
What is a Model Deployment in AI Runway actually?
I have blogged about AI Runway a few times now (here and here), but if I am honest, I never really understood what a model deployment actually is on the cluster. I click deploy in the dashboard, a model shows up and I call it through a gateway. Then I remembered Projects in AKS Desktop, which show an application with its resources, logs, metrics and access in one place. So I tried to get a model deployment into such a project. That works and nicely shows what a model deployment actually is, but only after fixing a handful of things, and I’ll explain them in this blog post.
The TL;DR
Run the first script, register the cluster in AKS Desktop and create an AKS managed project called llm-demo, run a second script that fixes the permissions and the quota of the project, deploy a model from the AI Runway dashboard into it, run a third script that fixes the networking, and then look at everything in AKS Desktop:
- Preparation: Clone https://github.com/tfenster/ai-runway-in-aks-desktop-project, run
az loginandaz extension add --name aks-preview - Run
01_create.ps1. It creates the cluster and deploys KAITO, the gateway and AI Runway. - In AKS Desktop, register the cluster and create an AKS managed project called
llm-demo. - Run
02_fix_project.ps1. It fixes the permissions and the quota that the project needs for a model deployment. - In the AI Runway dashboard, deploy Llama 3.2 1B into
llm-demowith the gateway enabled. - Run
03_fix_networking.ps1. It adds the network policies and fixes the model name for the gateway. - Look at the result in the project.
This will give you a good idea what a model deployment actually creates.
The details: What is a model deployment anyway?
In AI Runway, a model deployment is a ModelDeployment custom resource. This is what the dashboard creates for Llama 3.2 1B, trimmed to the interesting parts:
1
2
3
4
5
6
7
8
9
10
11
12
13
14
15
16
17
18
19
20
21
22
apiVersion: airunway.ai/v1alpha1
kind: ModelDeployment
metadata:
  name: llama3-2-1b-xuja
  namespace: llm-demo
spec:
  engine:
    type: llamacpp
  image: ghcr.io/kaito-project/aikit/llama3.2:1b
  model:
    id: llama3.2:1b
    source: huggingface
  provider:
    name: kaito
  resources:
    gpu:
      count: 0
      type: nvidia.com/gpu
  scaling:
    replicas: 1
  serving:
    mode: aggregated
That is only an intent, everything else is derived from it:
- The AI Runway controller validates the resource and records the selected engine and provider, which are both explicit here.
- The KAITO provider turns it into a KAITO
Workspace. - KAITO, running with node auto-provisioning disabled, creates a StatefulSet with one pod running the aikit image. The pod listens on port 5000, behind a Service on port 80.
- Because the Gateway API CRDs are present, AI Runway also creates an
InferencePool, an endpoint picker (EPP) deployment for it and anHTTPRoute. The route matches the model name in the headerX-Gateway-Model-Name.
A request then travels from the client to the gateway, where the body-based router copies the model field from the request body into that header. From there it goes through the HTTPRoute, the InferencePool and the EPP to the model pod.
The status of the ModelDeployment itself is coarse. It says Deploying with “Workspace created, waiting for pods to be ready” until the pod is up. So a model deployment is a handful of objects in one namespace, plus a route into a gateway that lives in another one. That sounds like something a project should help with, and the namespace is also where quota and network policies apply, which will matter shortly.
The details: Cluster and platform
The first script is mostly a collection of things I had to find out the hard way.
The cluster
AKS Desktop has requirements for the cluster that can’t be changed later. It needs Entra ID authentication with Azure RBAC, and it needs a network policy engine from the start, because otherwise network policies are silently ignored. I use Cilium. The example command in the docs failed for me with NetworkPolicy cilium requires NetworkDataplane cilium, so I added --network-plugin-mode overlay --network-dataplane cilium. --enable-azure-monitor-metrics is for the Metrics tab in a project. Three Standard_D4s_v5 nodes are enough for Istio, AI Runway, KAITO and a small CPU model, and I don’t need SSH access, so I disabled it. After the cluster exists, I give myself the Azure Kubernetes Service RBAC Cluster Admin role, get the credentials and convert the kubeconfig with kubelogin.
KAITO
I would have liked to use the AKS add-on (--enable-ai-toolchain-operator) as in my last post on AI Runway, but the add-on is built around GPU nodes that it provisions itself. When I deployed a CPU model with it, the KAITO webhook rejected the workspace with “Unsupported instance type” and a list of GPU SKUs. So I install KAITO with Helm and node auto-provisioning disabled, which means it uses the nodes that are already there. I use 0.10.0, the version AI Runway pins. The 0.13.0 chart has a new nodeProvisioner setting. I got it to work with nodeProvisioner=byo, because the old feature gate alone was not enough there, but I stayed with 0.10.0 for this post.
The order also matters. KAITO’s chart ships its own copy of the InferencePool CRD, which conflicts with the one from the Gateway API Inference Extension if Helm comes second. Installing KAITO first avoids that.
The gateway
Then comes the gateway stack from my earlier post with newer versions: Gateway API v1.7.0, Gateway API Inference Extension v1.6.2, Istio with the minimal profile and ENABLE_GATEWAY_API_INFERENCE_EXTENSION, and the body-based router in the gateway namespace. The inference-gateway.yaml is the same Gateway as before, plus a label that tells AI Runway which gateway to use:
1
2
3
4
5
6
7
8
9
10
11
12
13
14
15
16
apiVersion: gateway.networking.k8s.io/v1
kind: Gateway
metadata:
  name: inference-gateway
  namespace: gateway
  labels:
    airunway.ai/inference-gateway: "true"
spec:
  gatewayClassName: istio
  infrastructure:
    annotations:
      service.beta.kubernetes.io/port_80_health-probe_protocol: tcp
  listeners:
    - name: http
      protocol: HTTP
      port: 80
AI Runway
AI Runway itself is three manifests from the v0.8.0 tag: the controller, the dashboard and the KAITO provider shim. Without the shim, the dashboard tells you that no inference providers are registered. Authentication is enabled by default in the dashboard manifest, and on a clean install the dashboard asks me to run airunway login. I didn’t want to install anything locally for that, so the script turns the authentication off with kubectl set env. That is fine for a cluster that I delete afterwards and only reach through a port-forward, but I wouldn’t do it anywhere else. The last two lines of the script give me the Monitoring Data Reader role on the Azure Monitor workspace, which AKS Desktop needs to show metrics.
The details: The project
With the cluster in place, I register it in AKS Desktop. That means signing in with Azure, choosing “Add from Azure Subscription”, picking the cluster and clicking “Register Cluster”.
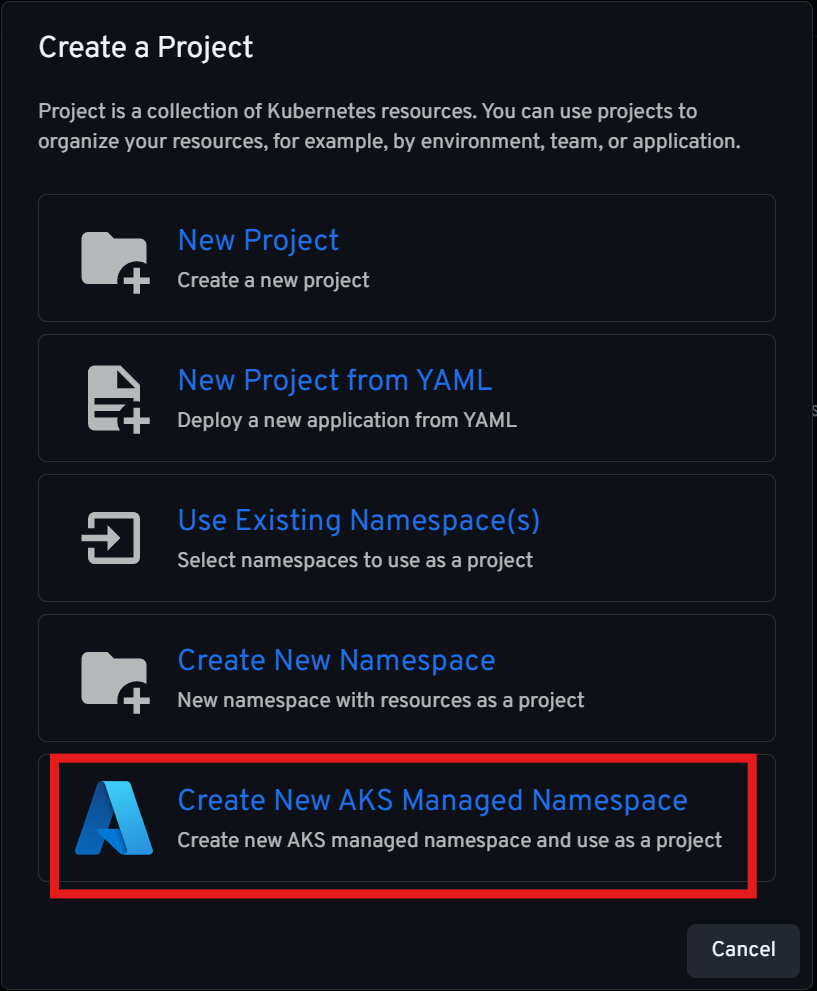
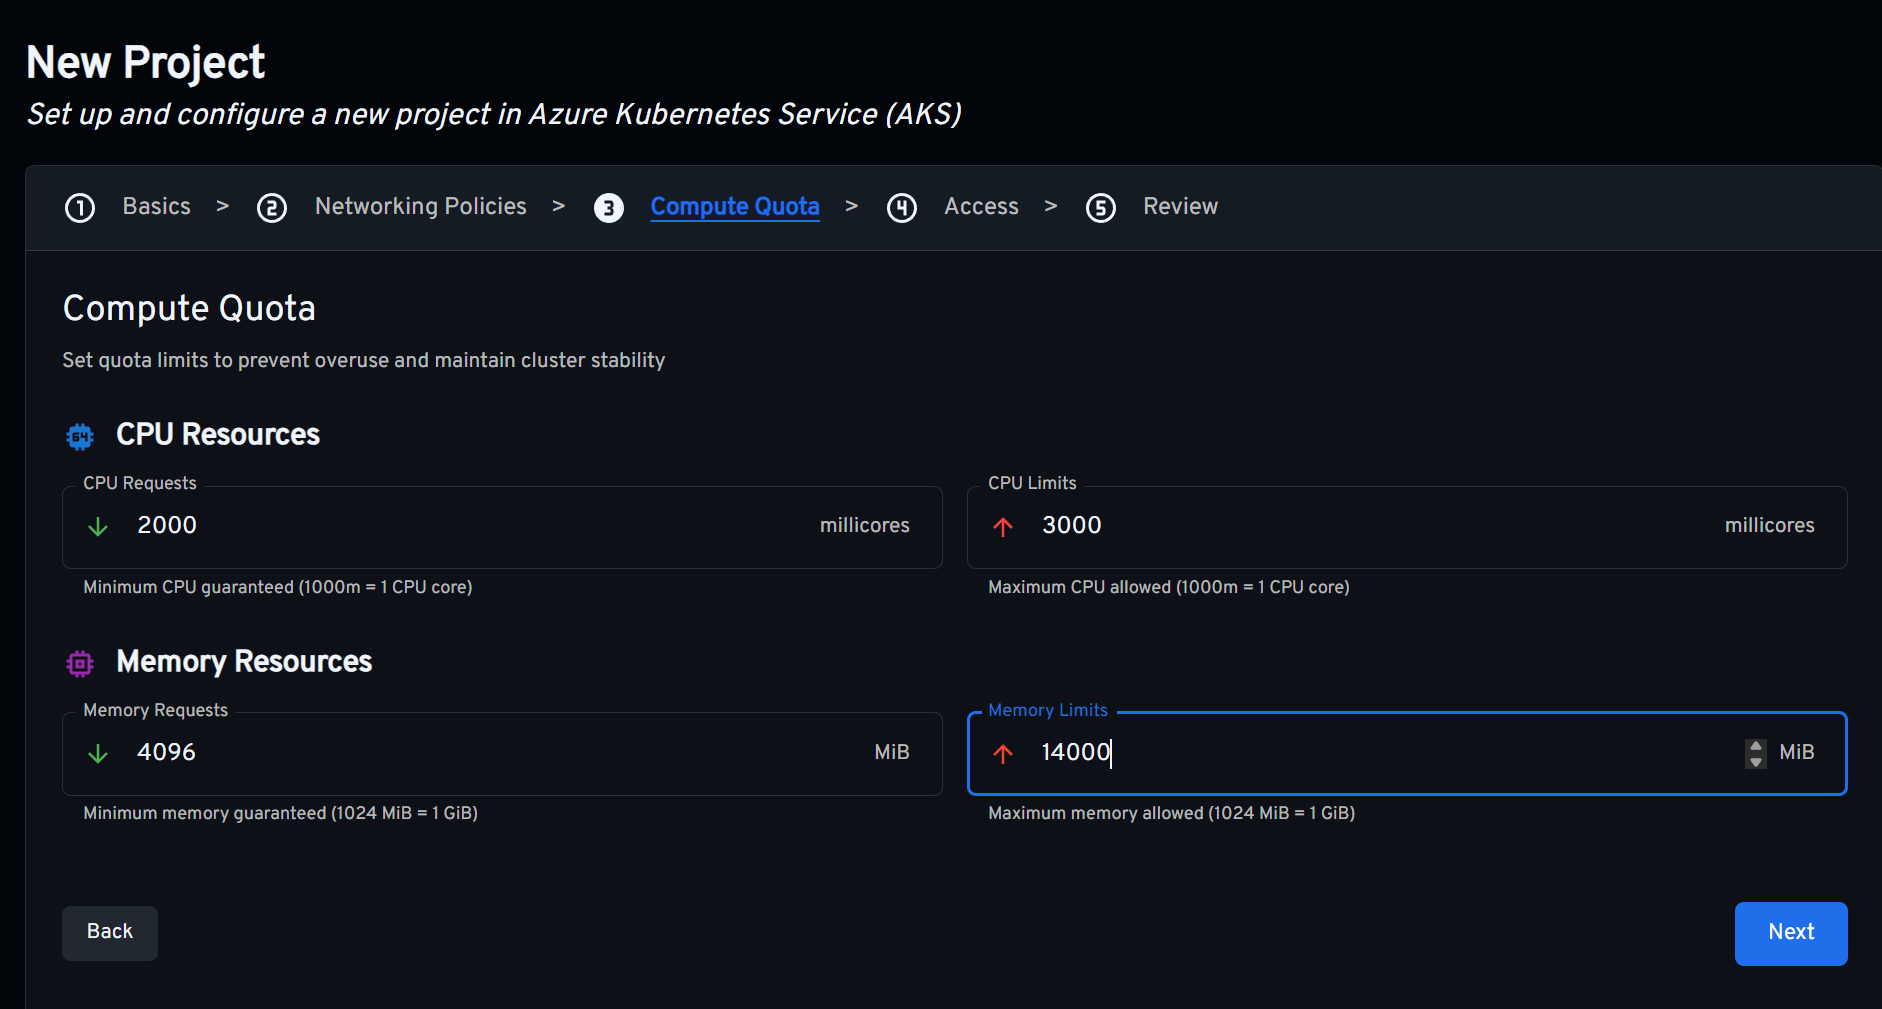
Then I create a new managed project, which creates an AKS managed namespace in the resource group of the cluster. The wizard has four steps: basics, networking policies, compute quota and access. I named the project llm-demo and kept the default for ingress, which only allows traffic from the same namespace.
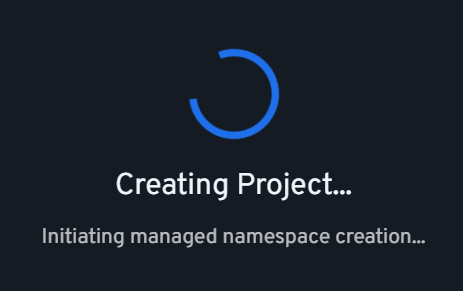
Then I saw this spinning for quite a while
At the end, AKS Desktop tried to assign roles to me and reported errors:
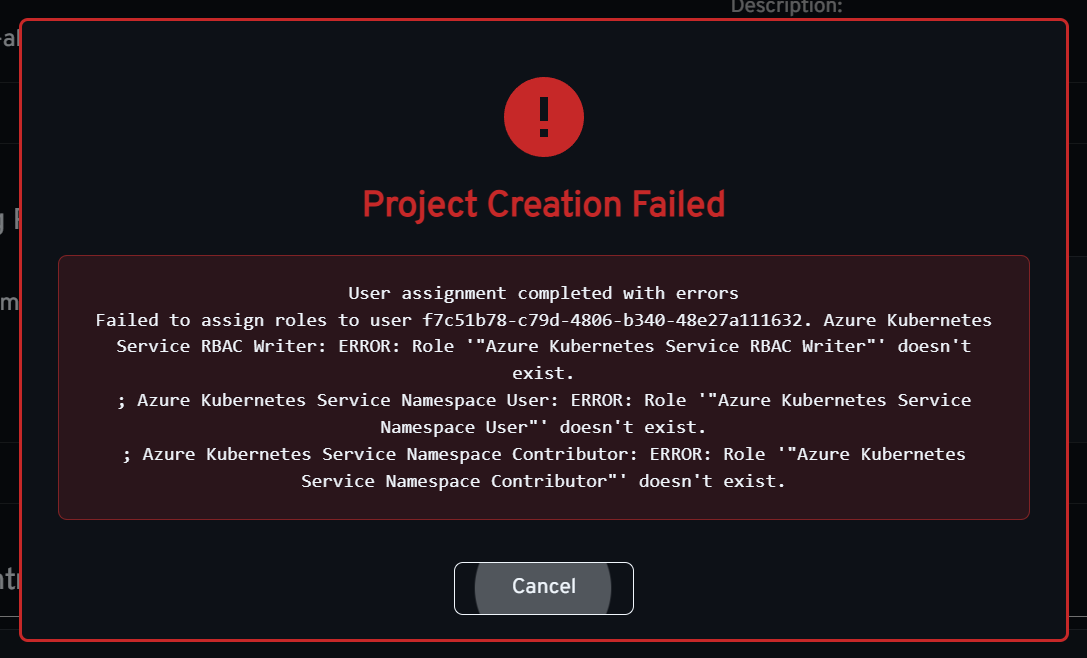
These roles do exist, and the quotes inside the quotes make me think this is a quoting problem on Windows. The namespace was created anyway, so I assign the roles with the CLI in the second script. Note that the project is created anyway, so this seems to be the very last step.
The details: Fixing the project
The second script fixes what the project needs before a model deployment can start.
1
2
3
4
5
6
7
8
9
$ME = az ad signed-in-user show --query id -o tsv
$NS = "llm-demo"
$AKS_ID = az aks show -g "rg-airunway-aksd" -n "aks-airunway-aksd" --query id -o tsv

az role assignment create --role "Azure Kubernetes Service Cluster User Role" --assignee $ME --scope $AKS_ID
az role assignment create --role "Azure Kubernetes Service Namespace User" --assignee $ME --scope "$AKS_ID/namespaces/$NS"
az role assignment create --role "Azure Kubernetes Service RBAC Writer" --assignee $ME --scope "$AKS_ID/namespaces/$NS"

kubectl apply -f limitrange.yaml -n $NS
Permissions
Lines 5-7 are the roles that AKS Desktop failed to assign. I left out the Namespace Contributor role from the error message, because it is only needed to create projects and I am cluster admin anyway.
Quota
The managed namespace comes with a resource quota called defaultresourcequota. Kubernetes then rejects every pod whose containers don’t declare CPU and memory requests and limits, and neither AI Runway nor KAITO set them for this container. The symptom is nasty, because the ModelDeployment just stays in Deploying with “Workspace created, waiting for pods to be ready” and no events at all. The real error is only visible in the events of the StatefulSet:
1
2
3
Warning  FailedCreate  3m23s (x19 over 25m)  statefulset-controller  Create Pod llama3-2-1b-9jqn-0 in StatefulSet
llama3-2-1b-9jqn failed error: pods "llama3-2-1b-9jqn-0" is forbidden: failed quota: defaultresourcequota: must specify
limits.cpu for: model; limits.memory for: model; requests.cpu for: model; requests.memory for: model
A LimitRange fixes that, because it gives containers default values before the quota is checked:
1
2
3
4
5
6
7
8
9
10
11
12
13
14
apiVersion: v1
kind: LimitRange
metadata:
  name: default-container-resources
  namespace: llm-demo
spec:
  limits:
    - type: Container
      defaultRequest:
        cpu: "1"
        memory: 2Gi
      default:
        cpu: "3"
        memory: 4Gi
The details: Deploying the model
The dashboard isn’t exposed, so I reach it with a port-forward:
kubectl port-forward -n airunway-system svc/airunway 3001:80
The settings page shows KAITO as a registered provider and the gateway with its IP, as in my earlier post. Then I deploy Llama 3.2 1B with the namespace set to llm-demo, KAITO as the provider and the gateway enabled. The model runs on CPU with llama.cpp, so no GPU is involved.
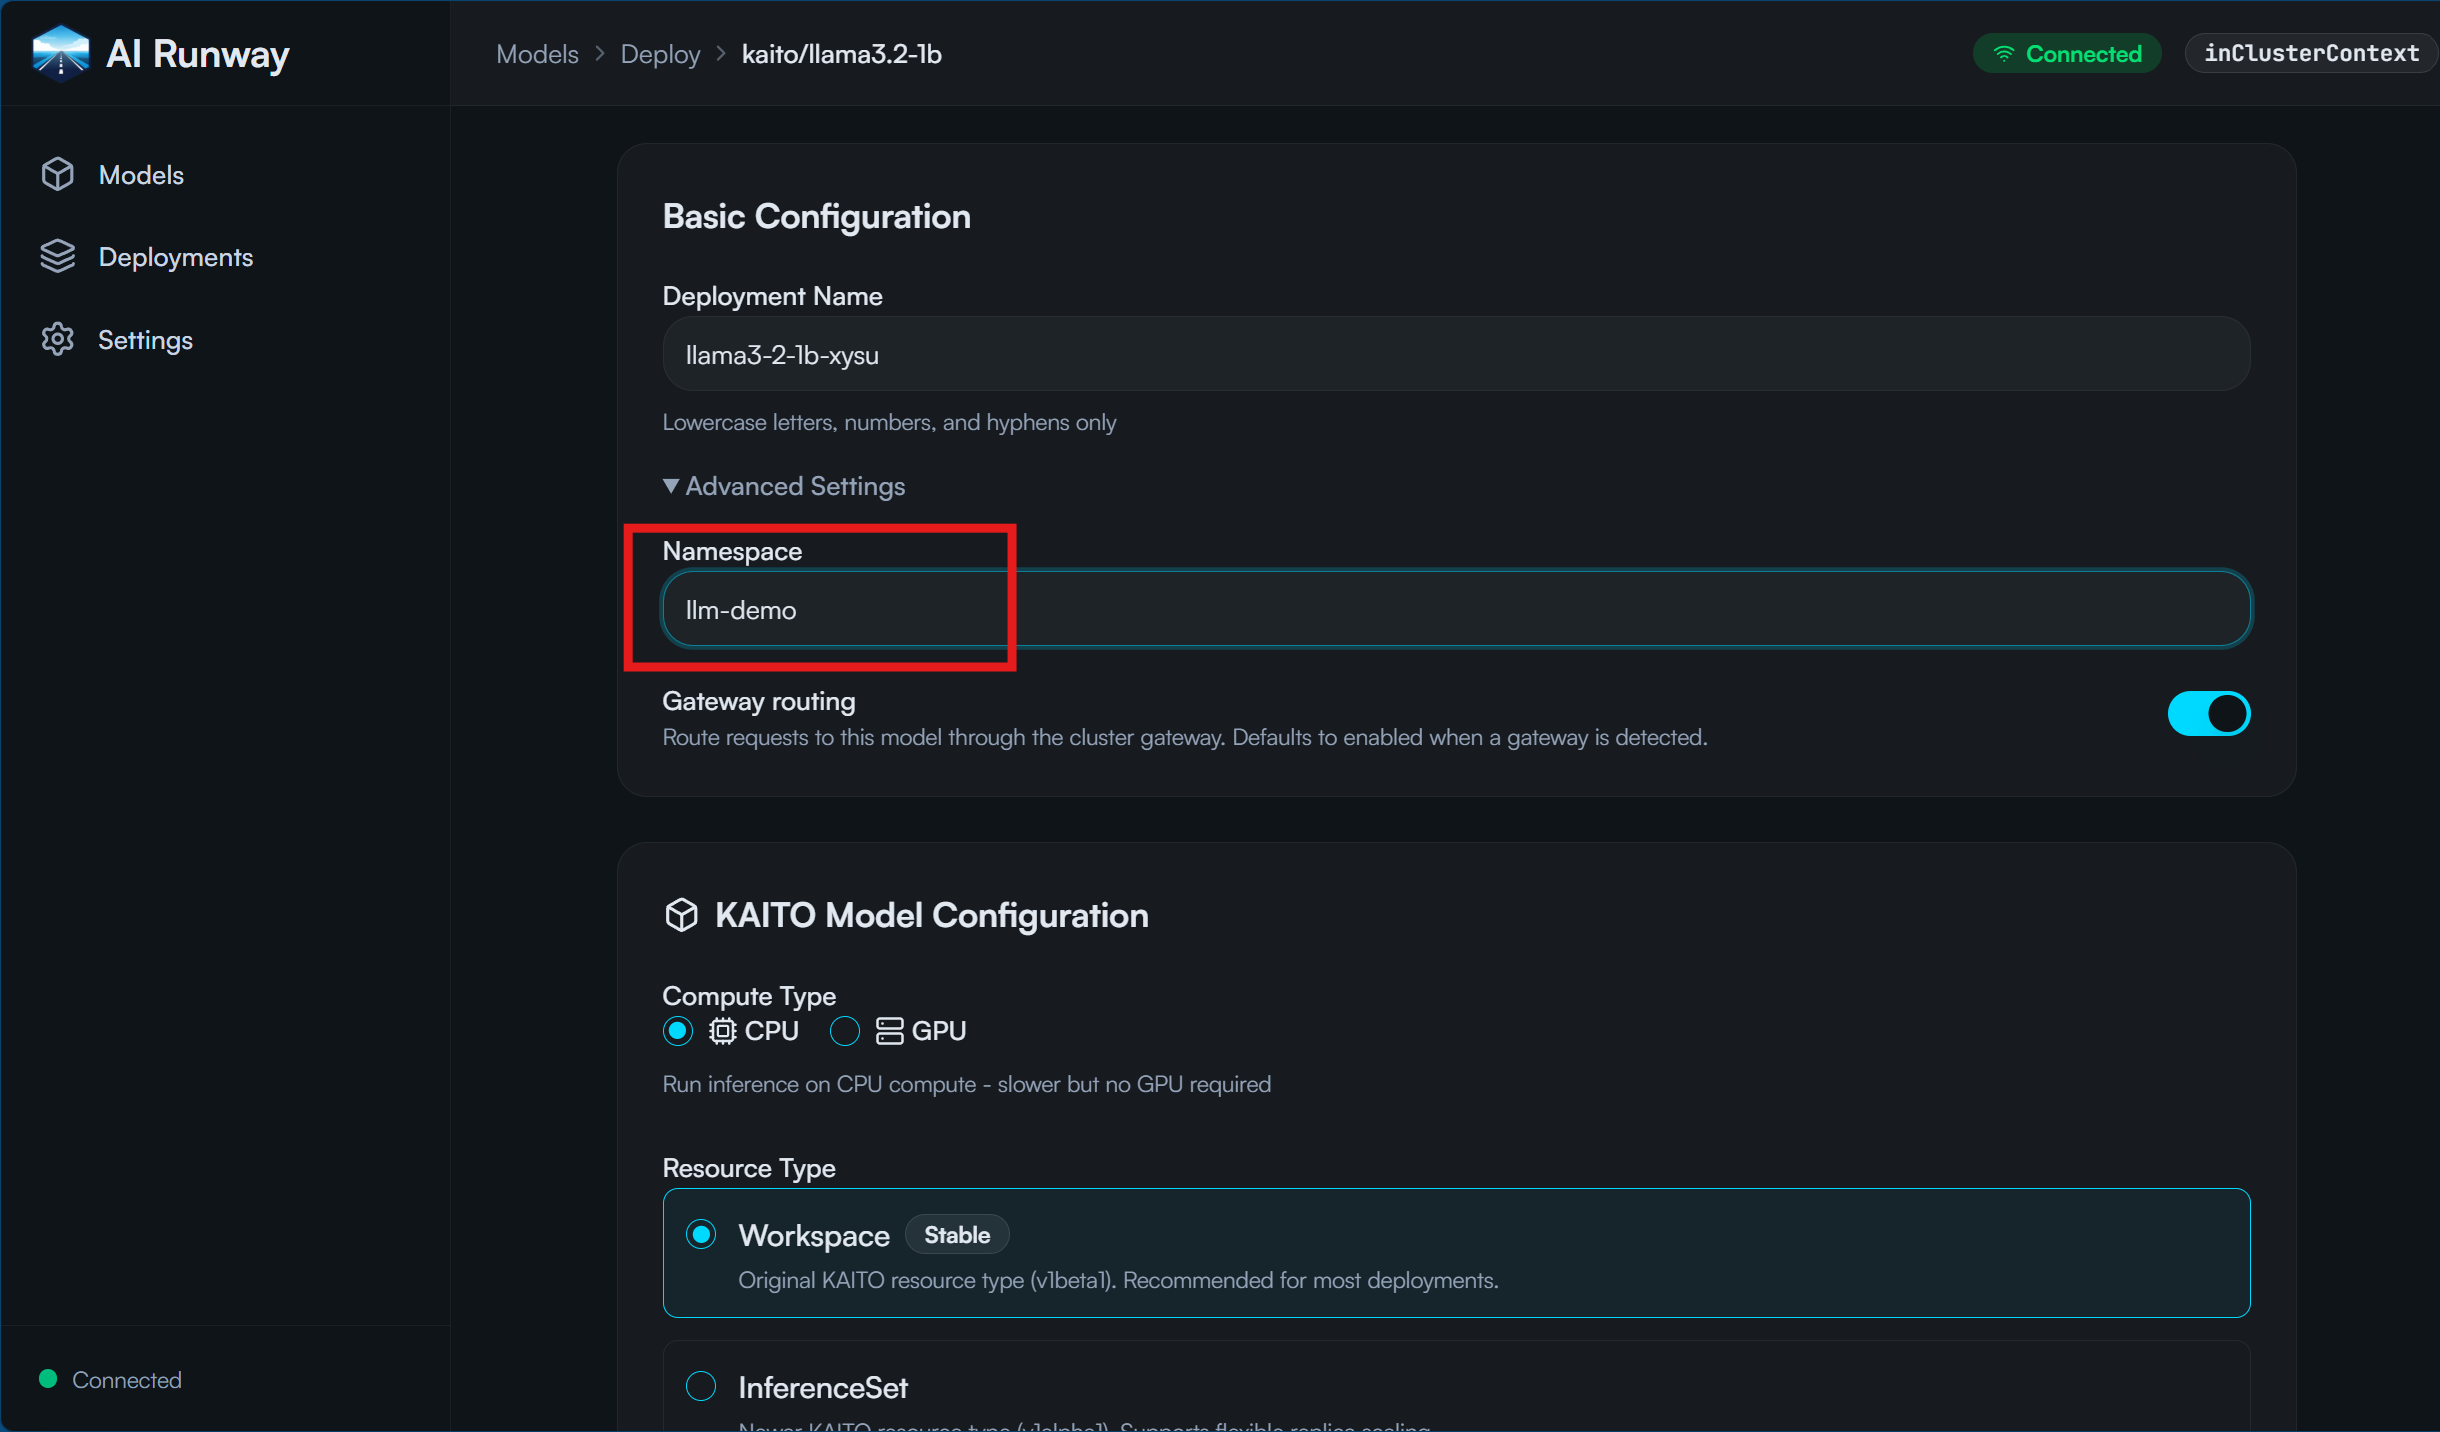
Once the pod is ready, I call the model through the gateway, using its IP from kubectl get gateway -n gateway inference-gateway, and nothing comes back:
1
2
3
PWSH> curl.exe -m 15 http://98.67.207.103/v1/chat/completions -H "Content-Type: application/json" `
 -d '{"model": "llama3.2:1b", "messages": [{"role": "user", "content": "Hello"}]}'
curl: (28) Operation timed out after 15011 milliseconds with 0 bytes received
The model runs, but I can’t reach it. The chat in the dashboard fails as well, with a 504 from the API server. Both are network problems, which is what the third script is for.
The details: Fixing the networking
The third script fixes the networking and the model name. The name fix needs a running model, so this script comes after the deployment.
1
2
3
kubectl apply -f .\network-policy.yaml
.\fix-gateway-model-names.ps1 -Namespace llm-demo
kubectl apply -f .\network-policy-chat.yaml
Network policy for the gateway
The default policy of the project only allows ingress from its own namespace, but the gateway lives in the gateway namespace. So I add a policy that admits traffic from there:
1
2
3
4
5
6
7
8
9
10
11
12
13
apiVersion: networking.k8s.io/v1
kind: NetworkPolicy
metadata:
  name: allow-inference-gateway
  namespace: llm-demo
spec:
  podSelector: {}
  policyTypes: [Ingress]
  ingress:
    - from:
        - namespaceSelector:
            matchLabels:
              kubernetes.io/metadata.name: gateway
With the policy, my request gets an error from the model server, which means it travelled through the gateway into the pod. Without it, nothing comes back, as I already saw right after the deployment:
1
2
3
4
5
6
7
8
9
10
11
12
13
14
PWSH> curl.exe -i -m 15 http://98.67.207.103/v1/chat/completions -H "Content-Type: application/json" `
 -d '{"model": "llama3.2:1b", "messages": [{"role": "user", "content": "Hello"}]}'
HTTP/1.1 404 Not Found
[...]
server: istio-envoy

{"error":{"code":404,"message":"model \"llama3.2:1b\" not found. To see available models, call GET /v1/models","type":"invalid_request_error"}}

PWSH> kubectl delete networkpolicy allow-inference-gateway -n llm-demo
networkpolicy.networking.k8s.io "allow-inference-gateway" deleted from llm-demo namespace

PWSH> curl.exe -i -m 15 http://98.67.207.103/v1/chat/completions -H "Content-Type: application/json" `
 -d '{"model": "llama3.2:1b", "messages": [{"role": "user", "content": "Hello"}]}'
curl: (28) Operation timed out after 15011 milliseconds with 0 bytes received
The model name
That 404 is good news for the network, but it points to the next problem. The HTTPRoute that AI Runway created matches X-Gateway-Model-Name: llama3.2:1b, which is the model.id, but the model server calls the model something else:
PWSH> curl.exe http://localhost:8080/v1/models
{"object":"list","data":[{"id":"llama-3.2-1b-instruct","object":"model"}]}
In April, the same image worked when I used llama-3.2-1b-instruct in the request. Now neither name works: the server rejects llama3.2:1b, and llama-3.2-1b-instruct finds no route and gets an empty answer. The AI Runway docs say the routing name is discovered from /v1/models and falls back to spec.model.id. For me it stayed at the fallback, even with a healthy pod. The documented override is spec.gateway.modelName, and setting it to the name from /v1/models fixes the route.
Because I don’t want to do that by hand for every model, fix-gateway-model-names.ps1 does it for all ModelDeployments in a namespace. For each one it waits for the pod, port-forwards to the service, reads the name from /v1/models and compares it with the route. If they differ, it sets spec.gateway.modelName. Models that already match are left alone. It only has something to do once a model exists, which is why it is part of the third script.
The chat in the dashboard
The chat in the AI Runway dashboard failed with a different error:
1
2
error trying to reach service: proxy error from localhost:9443 while dialing 10.244.0.80:5000, code 504:
504 Gateway Timeout
This is the service proxy of the Kubernetes API server, which on AKS reaches pods through a tunnel agent in kube-system. The project’s default policy blocks that agent as well. The last policy admits only those pods and not all of kube-system:
1
2
3
4
5
6
7
8
9
10
11
12
13
14
15
16
apiVersion: networking.k8s.io/v1
kind: NetworkPolicy
metadata:
  name: allow-api-server-proxy
  namespace: llm-demo
spec:
  podSelector: {}
  policyTypes: [Ingress]
  ingress:
    - from:
        - namespaceSelector:
            matchLabels:
              kubernetes.io/metadata.name: kube-system
          podSelector:
            matchLabels:
              app: konnectivity-agent
With that, the chat works. It also means that everyone who may use the API server proxy for that namespace can reach the model, but that is the same as in a namespace without the project’s policies.
With all three scripts done, the request from before works, now with the name that the model server uses:
1
2
3
4
5
6
7
8
9
10
11
12
13
14
15
16
17
18
19
20
21
curl http://98.67.207.103/v1/chat/completions -H "Content-Type: application/json" `
 -d '{"model": "llama-3.2-1b-instruct", "messages": [{"role": "user", "content": "Hello"}]}'

HTTP/1.1 200 OK
x-envoy-upstream-service-time: 601
x-went-into-resp-headers: true
x-correlation-id: cc2f3fb5-cbac-4019-897f-83f24aaacd2a
x-content-type-options: nosniff
x-frame-options: SAMEORIGIN
date: Sun, 08 Nov 2026 17:55:58 GMT
content-security-policy: default-src 'self'; script-src 'self' 'unsafe-inline' 'unsafe-eval' blob:; style-src 'self' 'unsafe-inline'; img-src 'self' data: blob: https:; media-src 'self' data: blob:; font-src 'self' data:; connect-src 'self' ws: wss: https: blob:; frame-src 'self' blob:; worker-src 'self' blob:; object-src 'none'; base-uri 'self'; form-action 'self'; frame-ancestors 'self'
content-type: application/json
referrer-policy: strict-origin-when-cross-origin
vary: Origin
server: istio-envoy
transfer-encoding: chunked

{"created":1794160557,"object":"chat.completion","id":"a48b7ffd-e8bd-458f-a220-c238fd6c6438",
"model":"llama-3.2-1b-instruct","choices":[{"index":0,"finish_reason":"stop",
"message":{"role":"assistant","content":"Hello! How can I assist you today?"}}],
"usage":{"prompt_tokens":36,"completion_tokens":10,"total_tokens":46}}
It returns a normal completion, and the chat in the dashboard works as well.
The details: How it comes together in the project
Now to the reason I did all this. The project llm-demo is the AKS managed namespace, so every object from above lives in it, and AKS Desktop is a view on that namespace. These are the views I looked at.
Overview and resources
The overview appears even though I didn’t deploy anything through AKS Desktop. The docs say that you get it after deploying an application through AKS Desktop, but here it simply shows what is in the namespace, no matter who put it there.
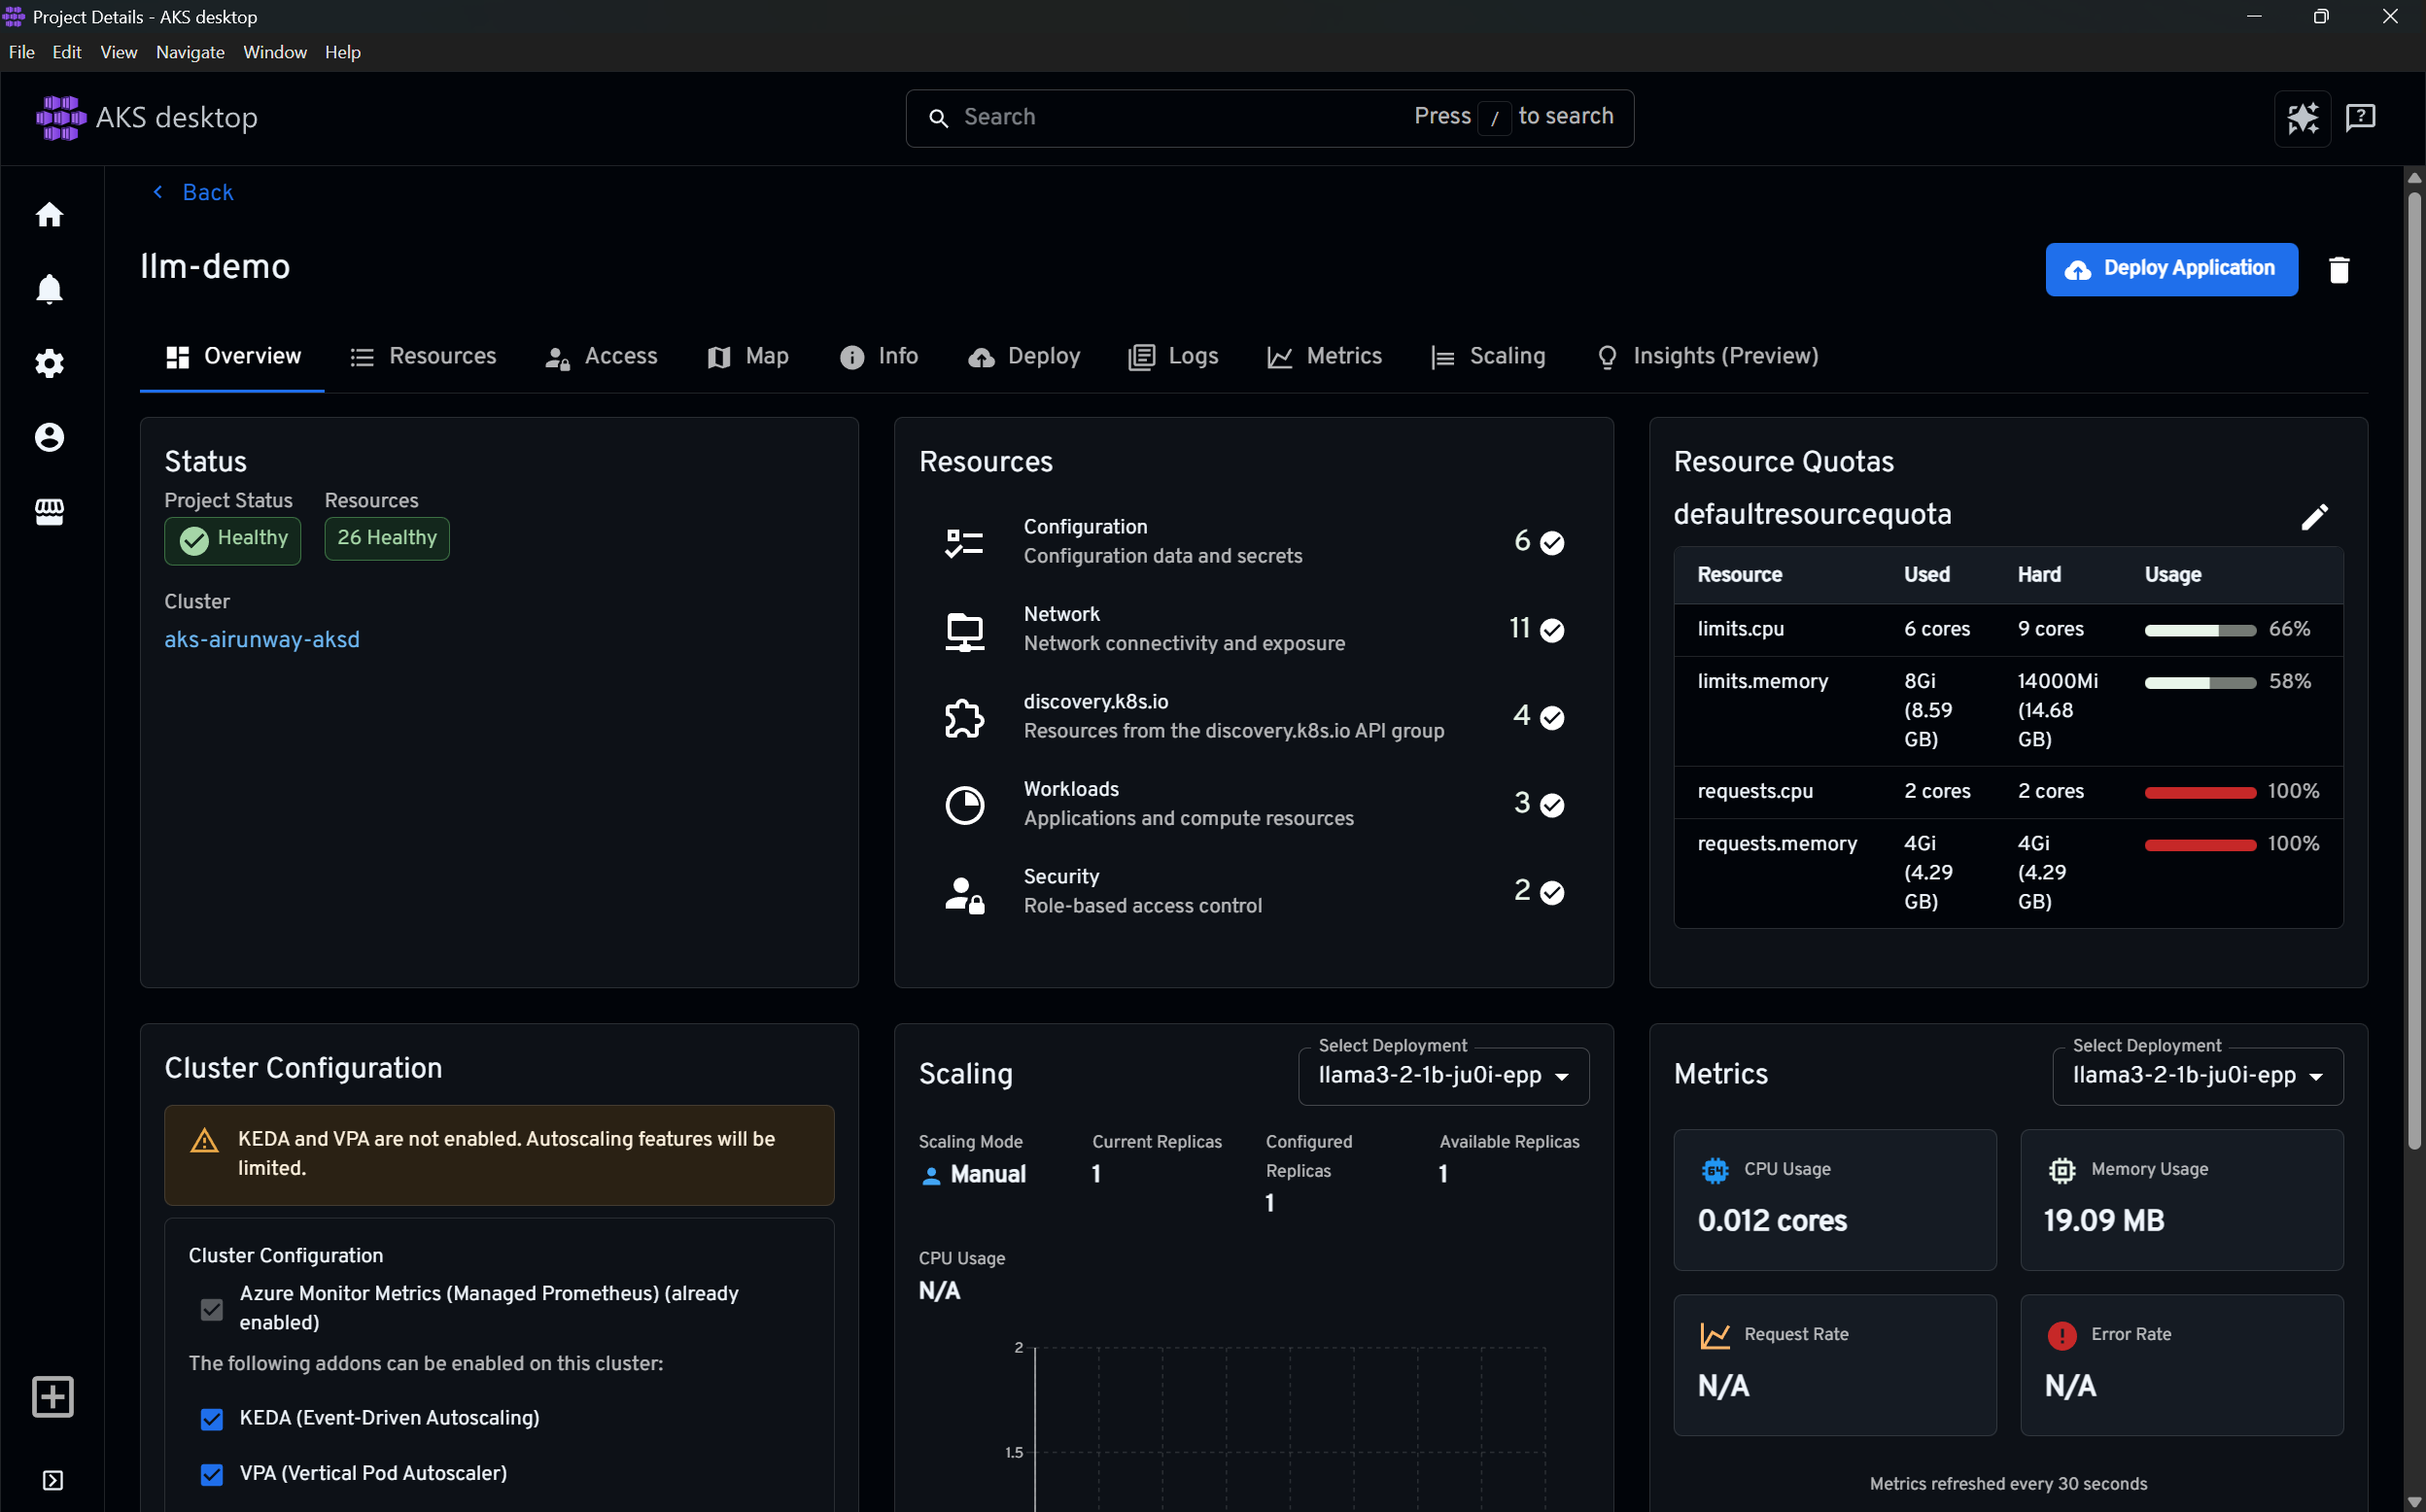
The status card says that the project is healthy with 26 resources, and the resources card sorts them into five groups: 6 configuration objects, 11 network objects, 4 from discovery.k8s.io, 3 workloads and 2 security objects. The resources tab shows the same groups. The workloads group lists the StatefulSet of the model, which KAITO created from the Workspace, and the Deployment of the endpoint picker with its ReplicaSet, which AI Runway created, all healthy with 1/1 replicas. Pods are not listed, only the controllers. The counts match what the map shows later: the 11 network objects are the 4 Services, their 4 Endpoints and the 3 network policies, the 4 discovery.k8s.io objects are the EndpointSlices, and the 6 configuration objects are the four ConfigMaps and the two ServiceAccounts. The 2 security objects are probably the Role and RoleBinding of the endpoint picker.
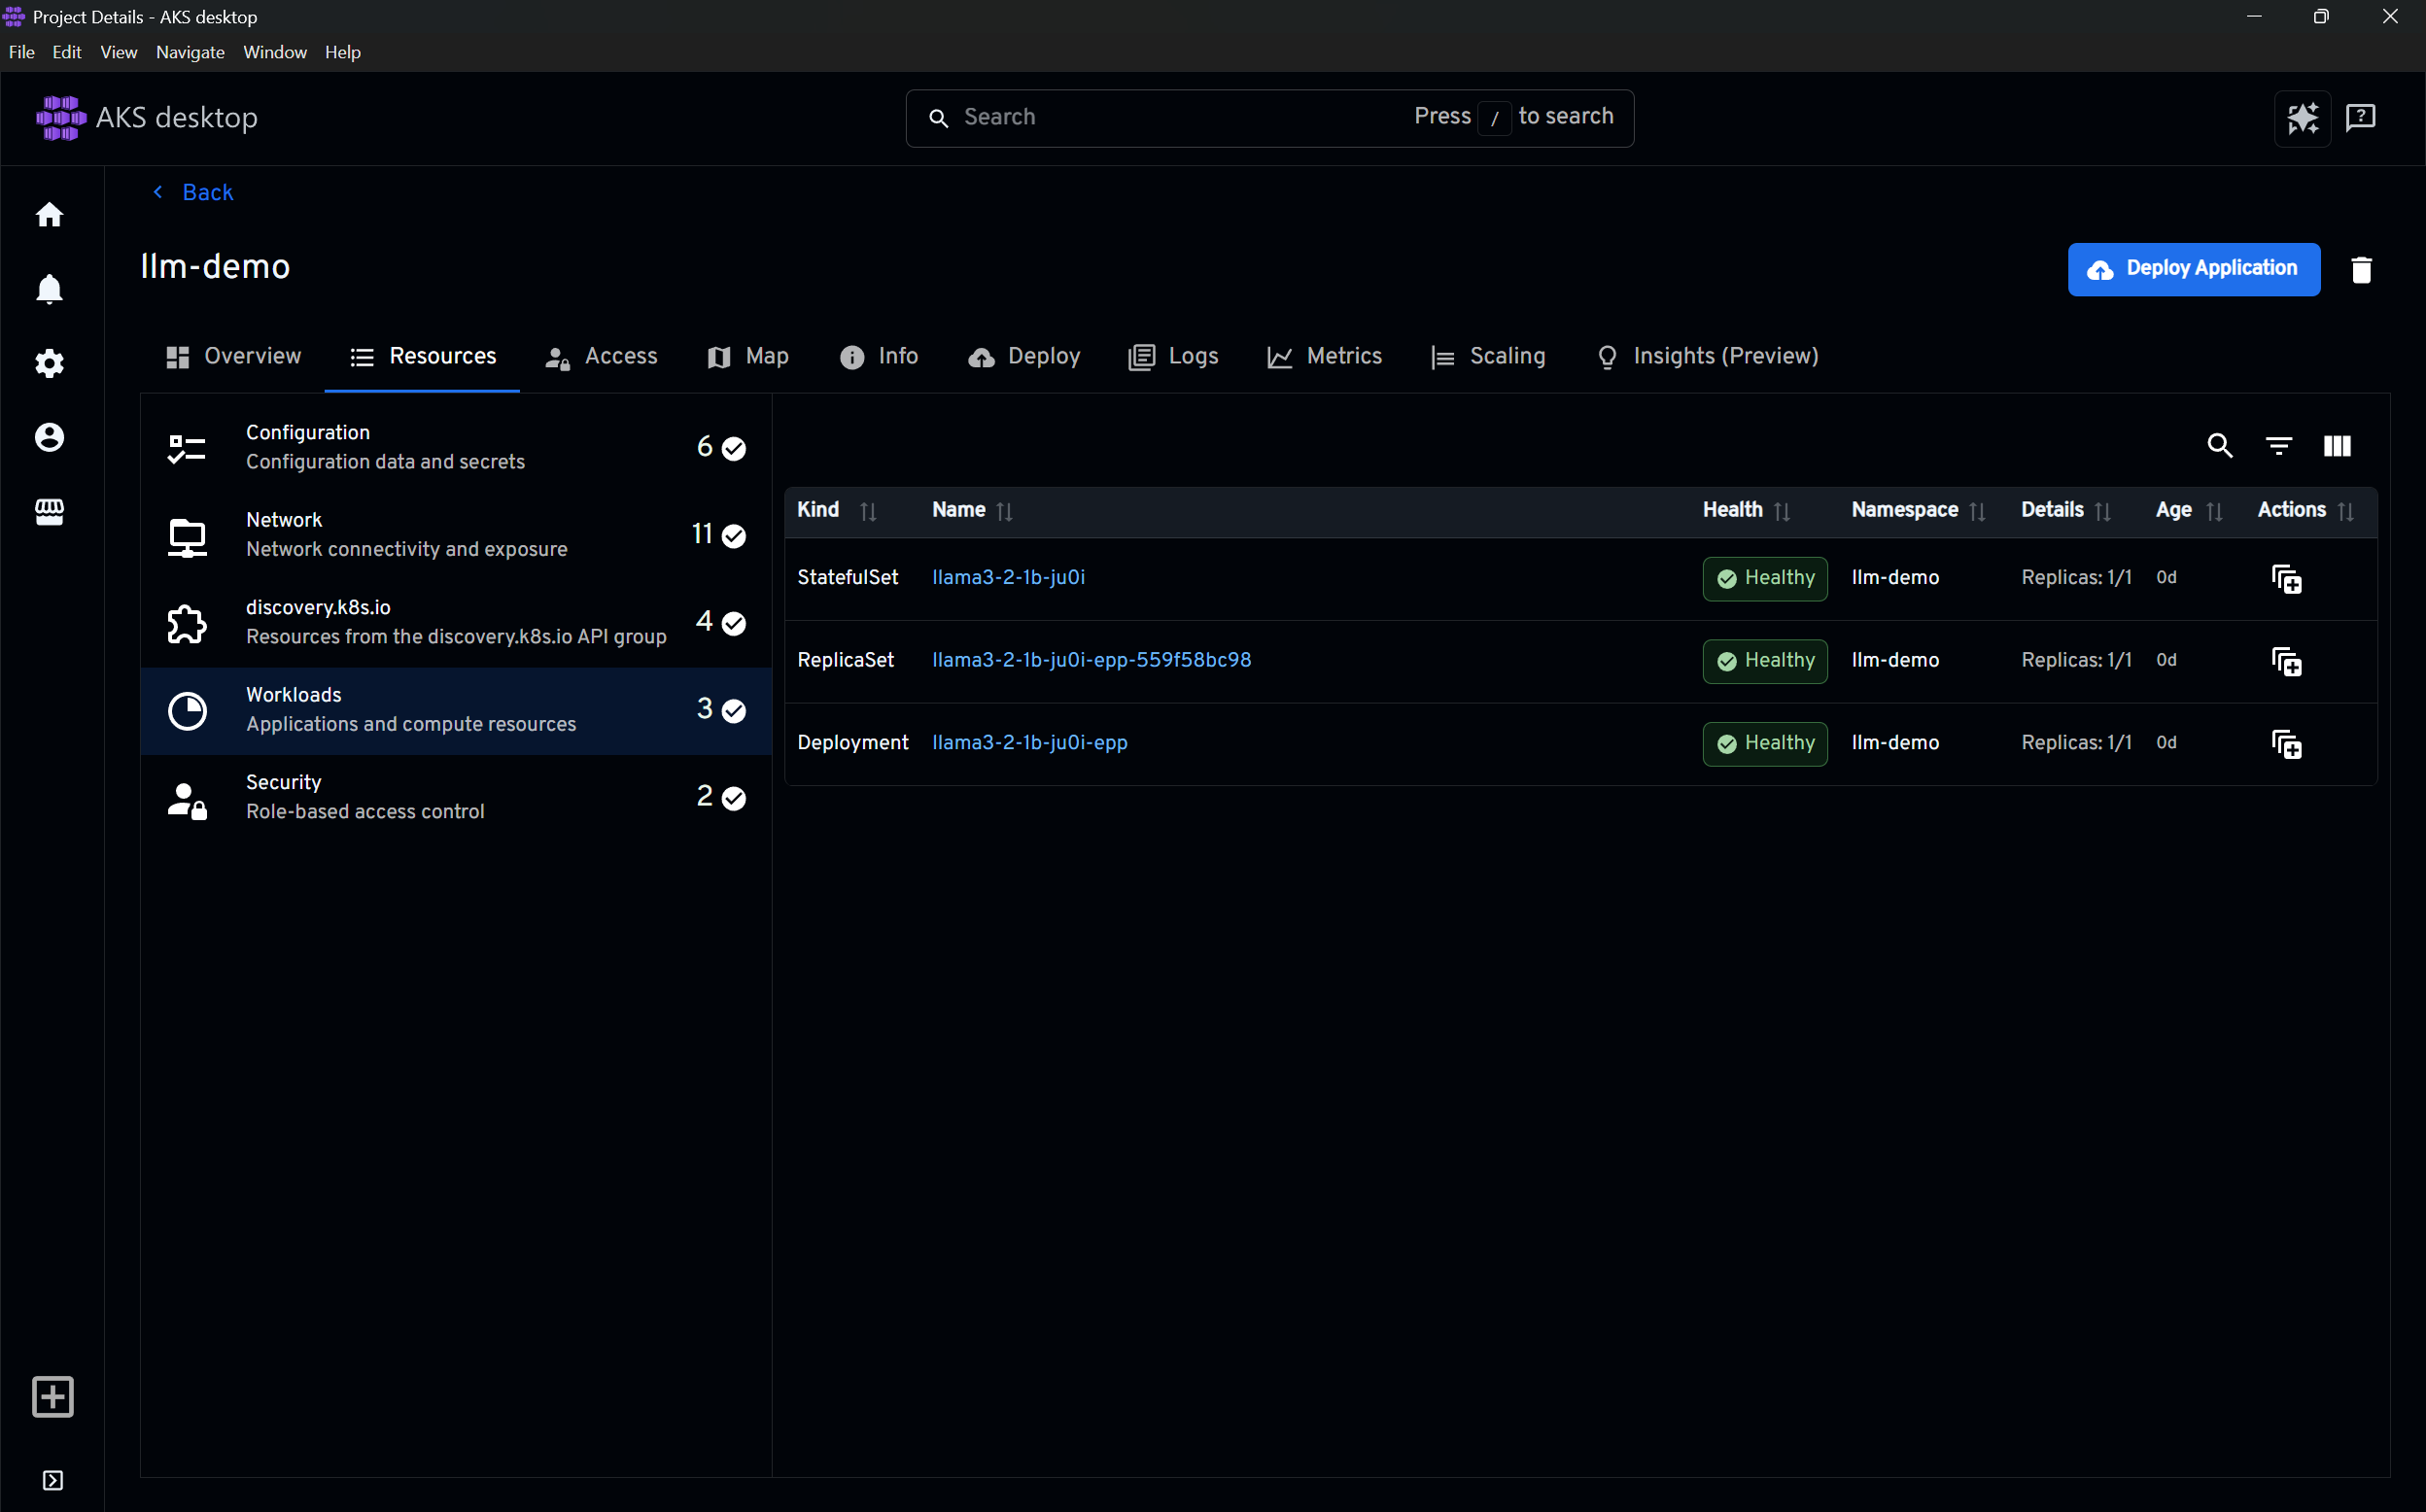
What I can’t find in the overview or in the resources tab are the custom resources. The five groups add up to the 26 resources, and none of them is a custom resource group, so the ModelDeployment, the KAITO Workspace, the InferencePool and the HTTPRoute are neither counted nor listed. They only appear on the map.
The overview also shows the resource quota of the project, and this is where the earlier problems become visible. limits.cpu is at 6 of 9 cores, because the model pod and the endpoint picker each got 3 cores from the LimitRange of 02_fix_project.ps1. Requests are at 100 percent for both CPU (2 cores) and memory (4Gi), shown in red, so there is no room for another pod. Both numbers follow from the 1 core and 2Gi that the LimitRange gives every container as a request.
Map
The map is the view that shows best what a model deployment is made of. Grouped by namespace, it first lists the objects of the project as tiles. The ModelDeployment from the dashboard, the Workspace from KAITO and the InferencePool from AI Runway are all there, next to the quota from the project wizard and the LimitRange from the second script, the default ServiceAccount, three ConfigMaps (two of them from Istio), an Istio DestinationRule for the endpoint picker and the Cilium endpoints of the two pods.
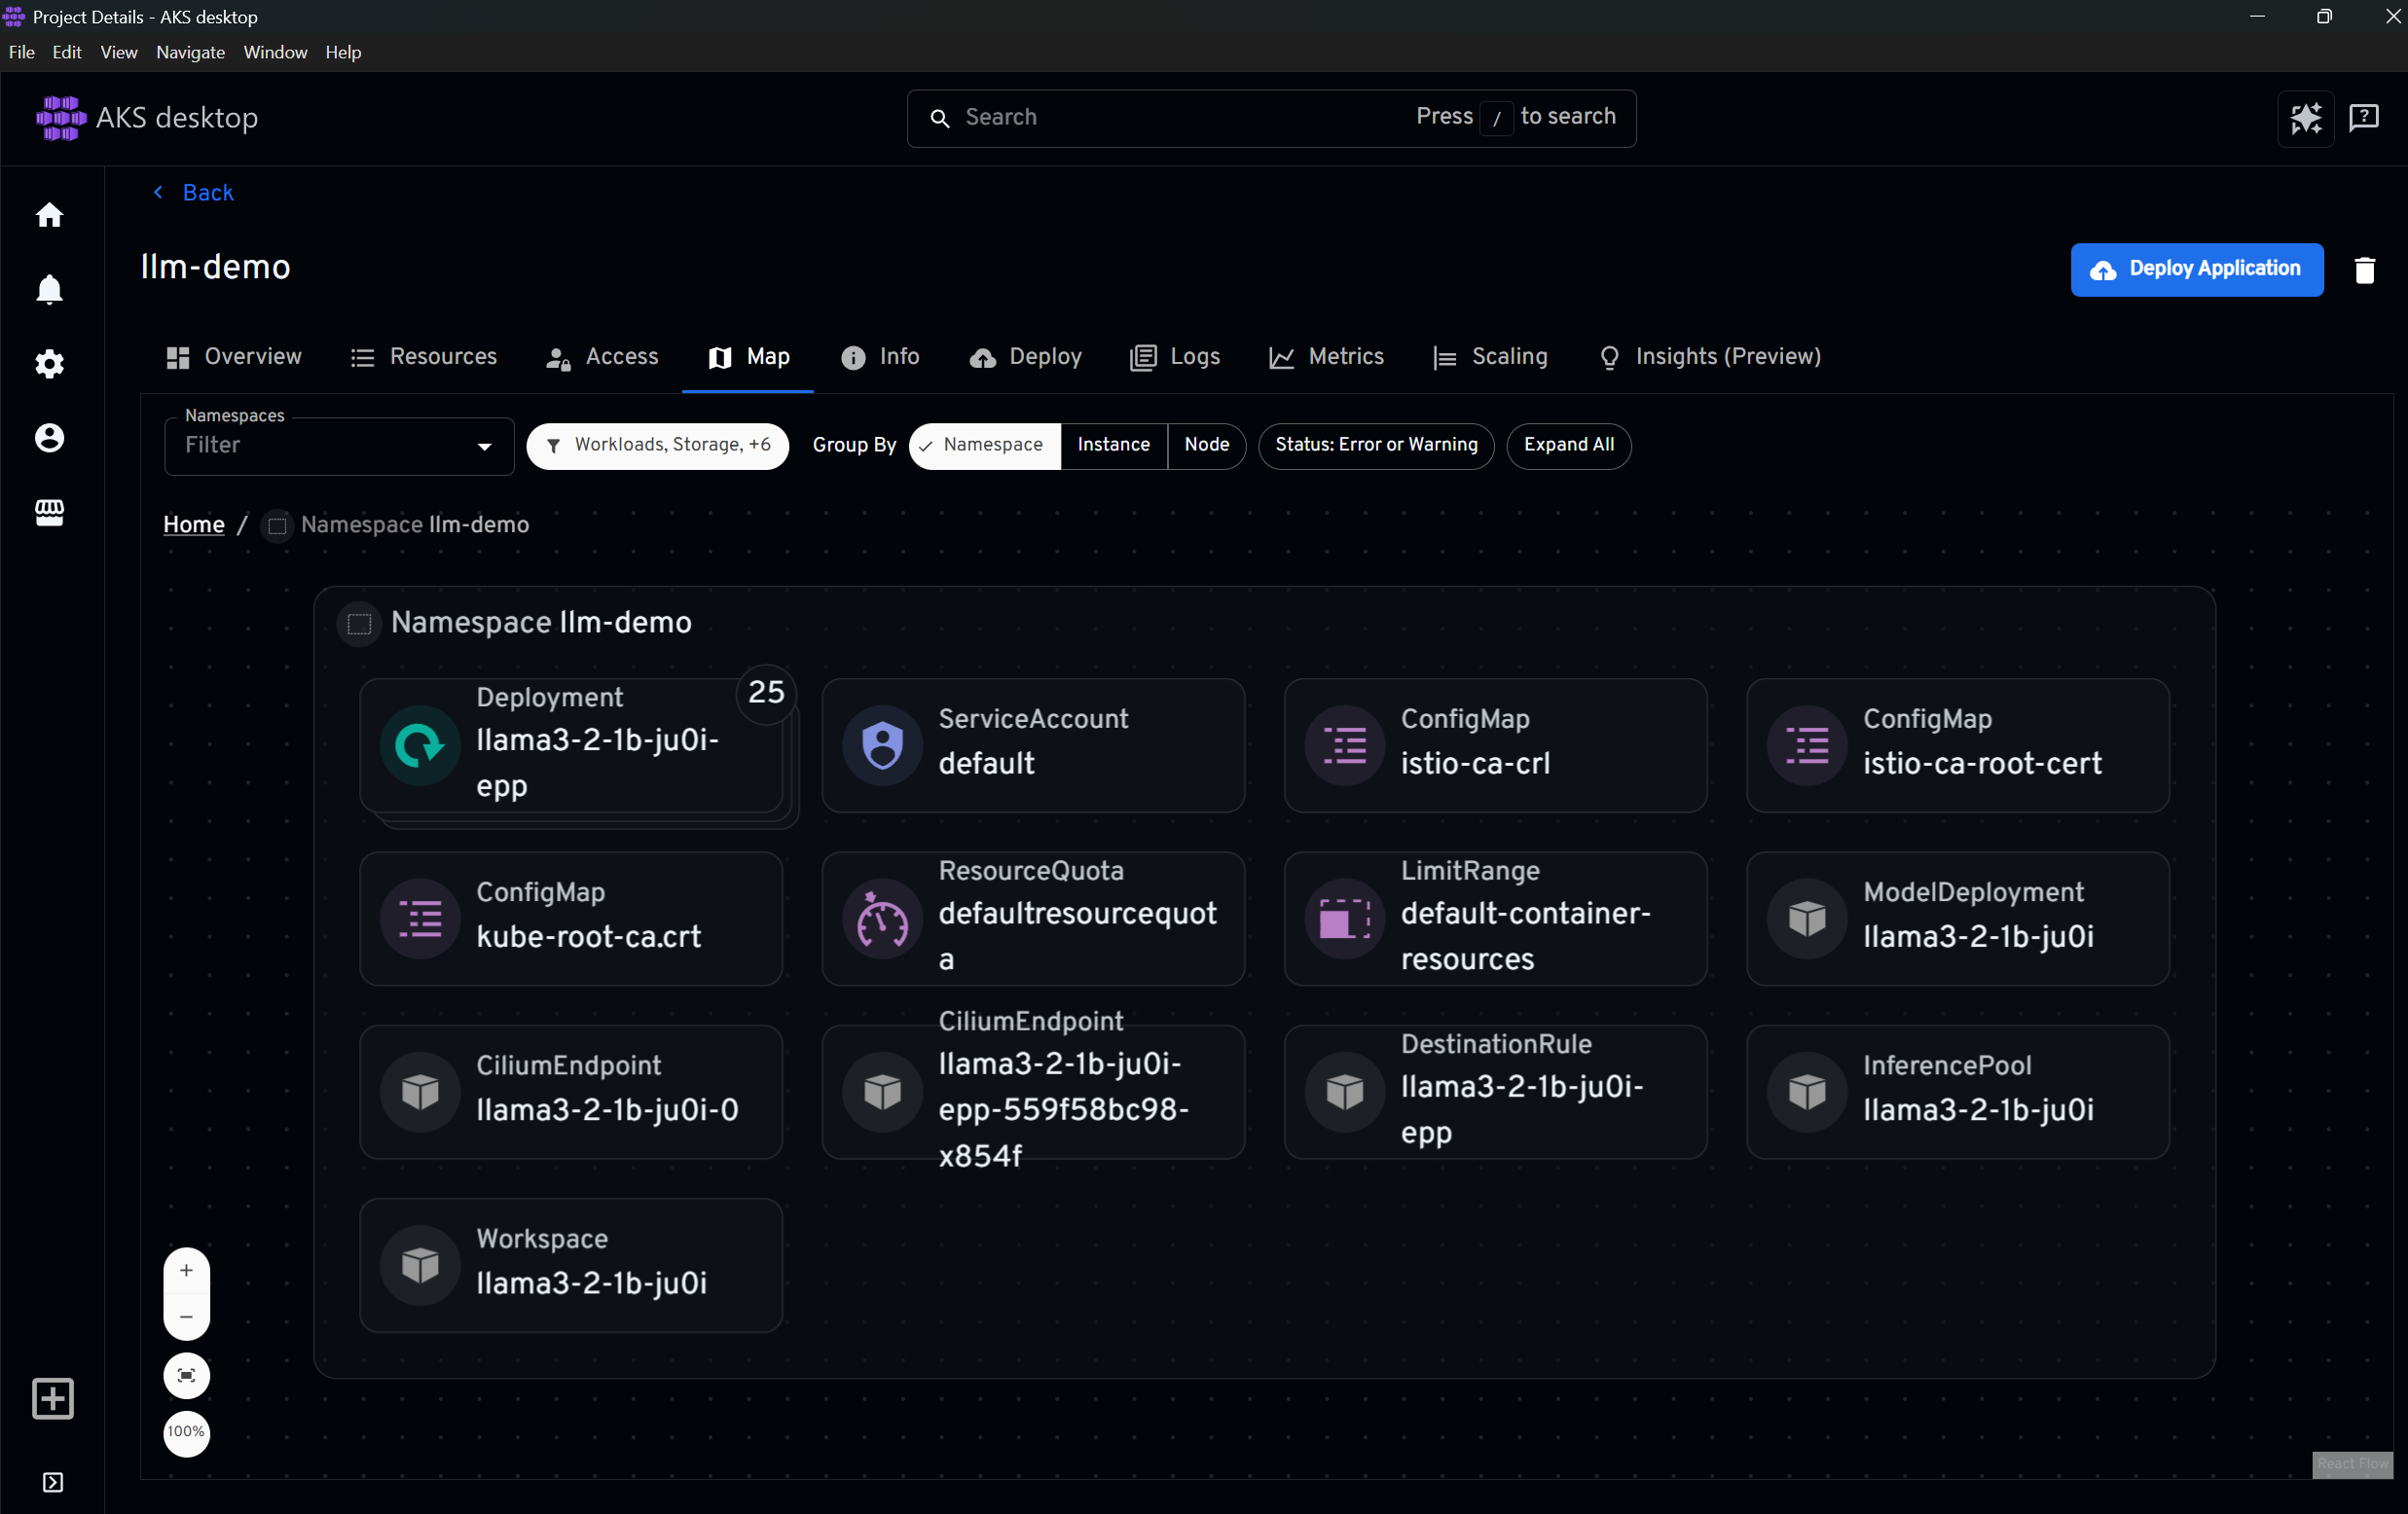
Expanding that Deployment opens the graph. It is the root, with the ReplicaSet and the pod of the endpoint picker, the StatefulSet and the pod of the model, and the ServiceAccount, RoleBinding and Role that the endpoint picker needs. So the map puts both parts of the model deployment into one graph.
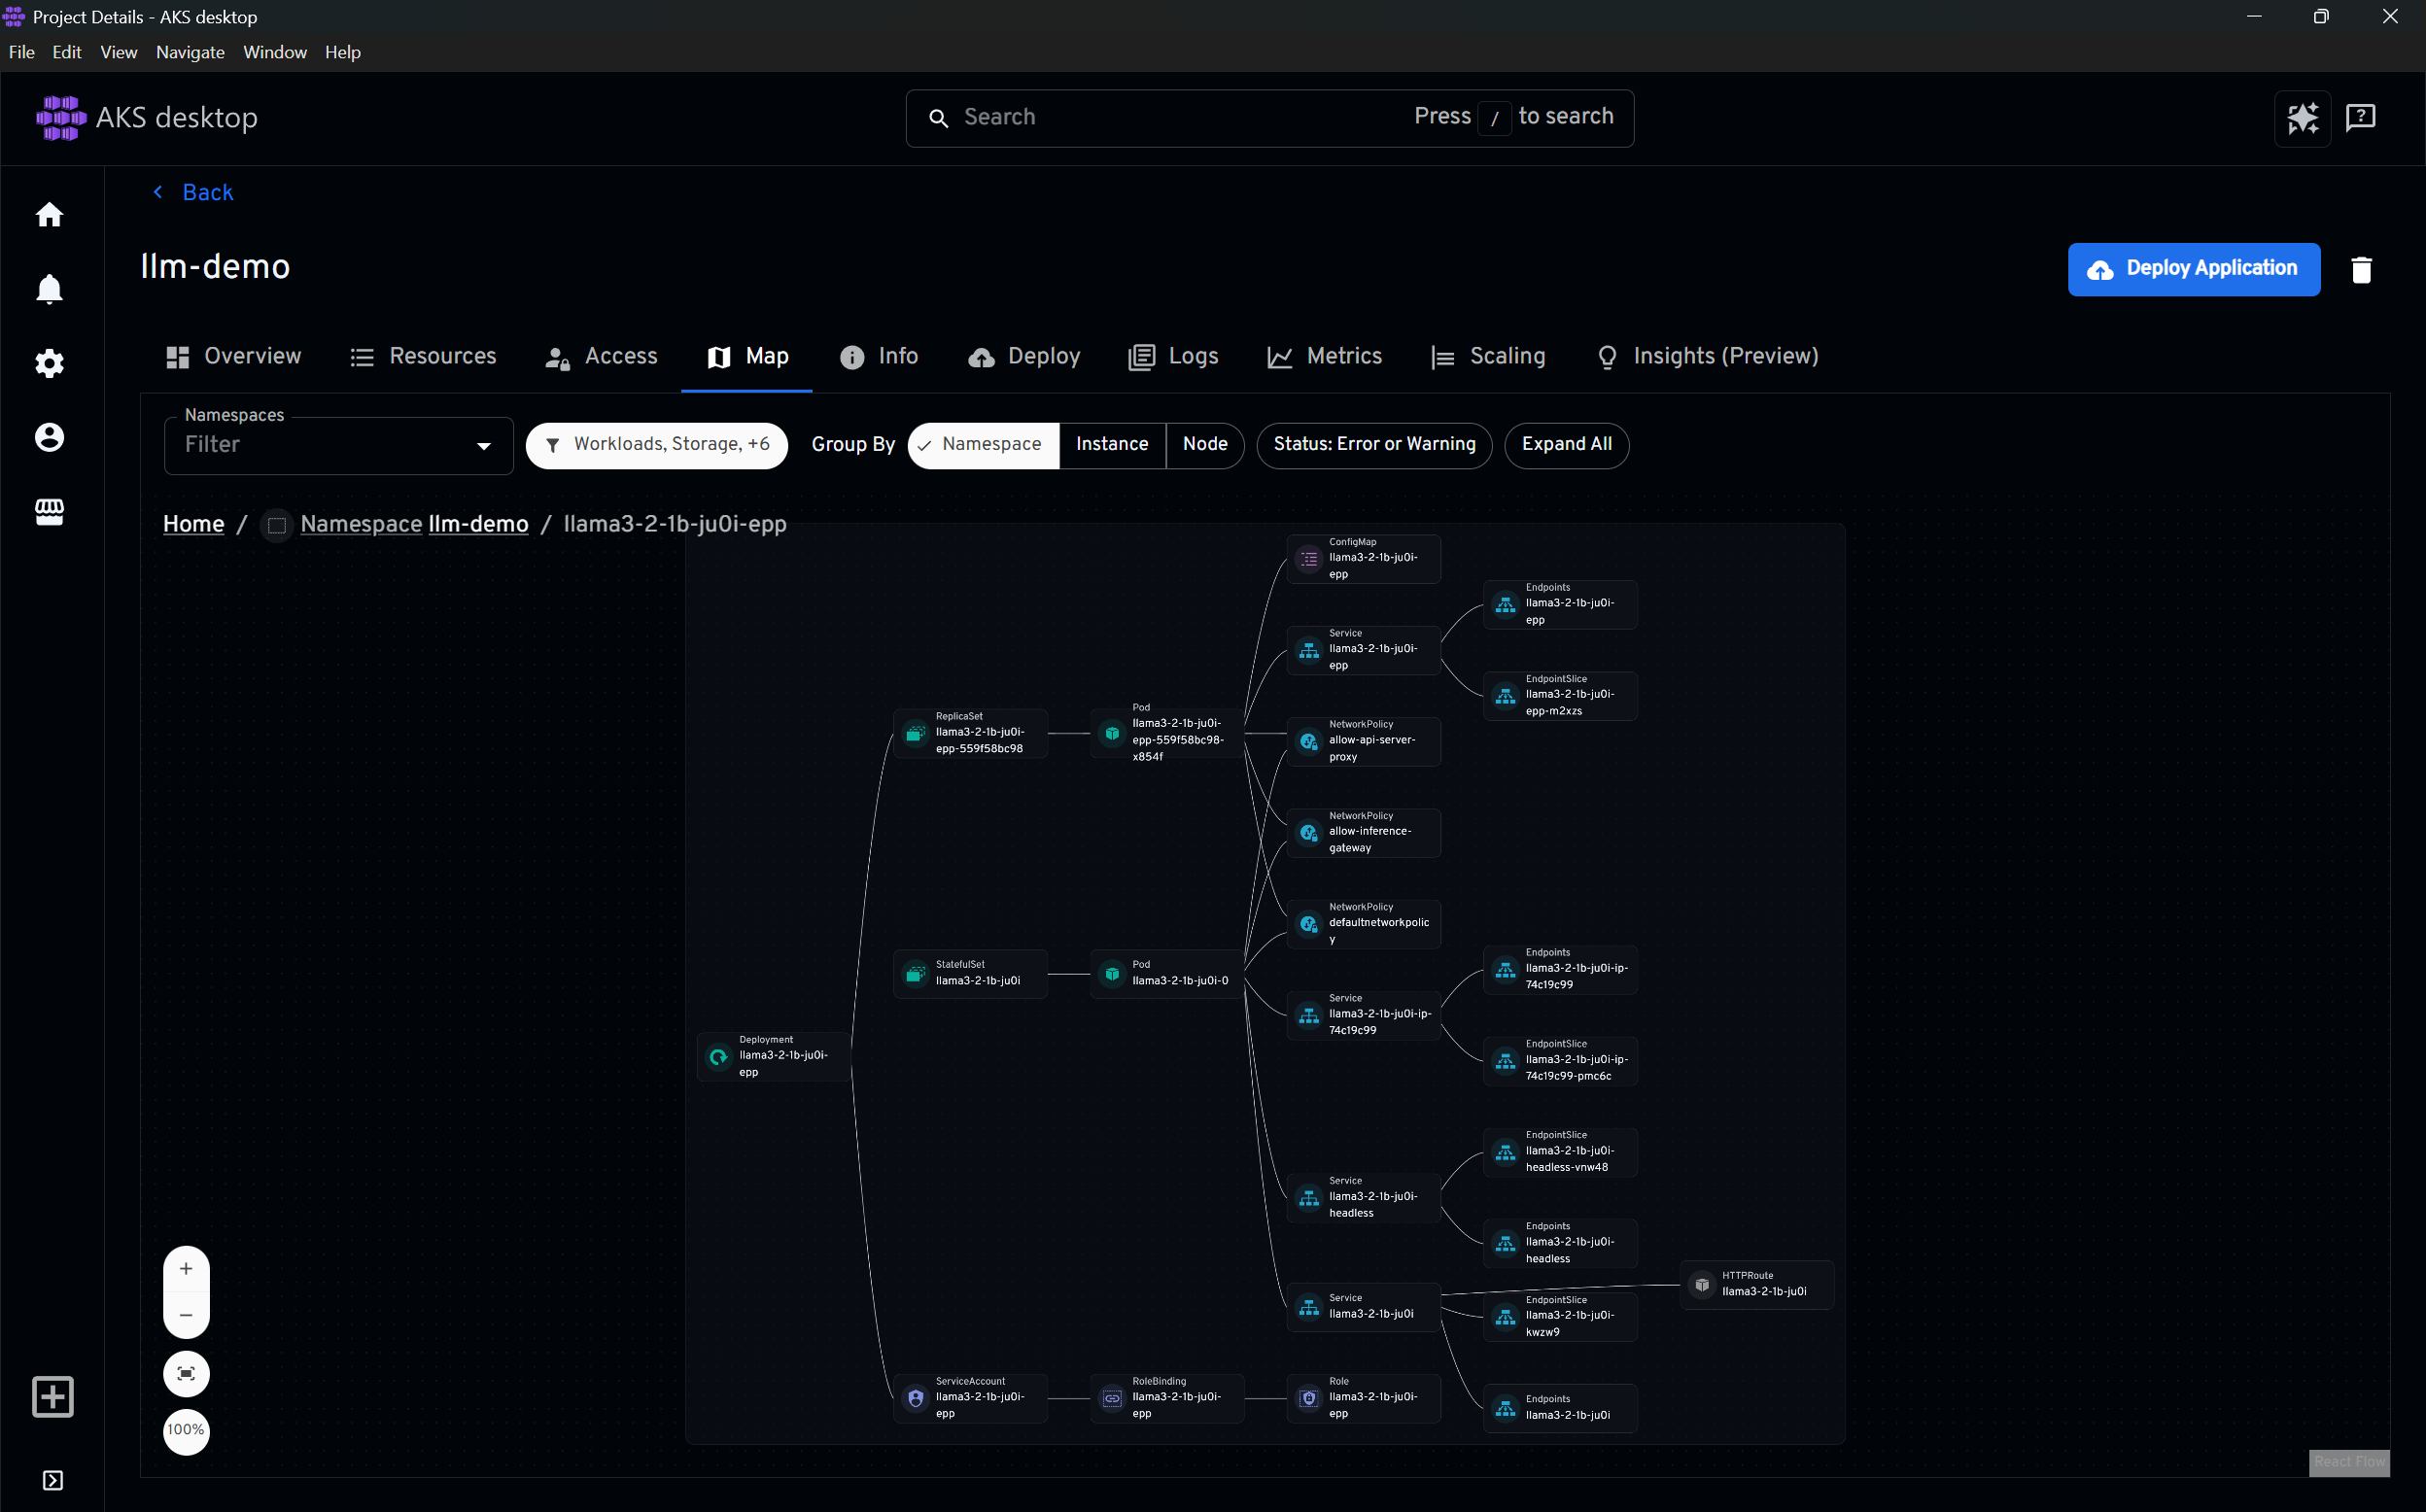
The pods connect to their Services. The model has three of them (a regular one, a headless one and one with an ip- suffix) and the endpoint picker has its own, each with its Endpoints and EndpointSlice. The pods also connect to the three network policies that apply to them: defaultnetworkpolicy from the project wizard, and allow-inference-gateway and allow-api-server-proxy from 03_fix_networking.ps1. So the map shows policies that I applied with kubectl and not through AKS Desktop, and it shows all three side by side.
The HTTPRoute is connected to the regular model Service, which is the last piece of the chain from the beginning of this post. Its header match is the one that spec.gateway.modelName fixed in 03_fix_networking.ps1, but the tile only shows kind and name, so the fix itself isn’t visible here. What I don’t see is the other end. The Gateway and the body-based router from the first script live in the gateway namespace, so they are not part of the map of the project. The ModelDeployment, the Workspace and the InferencePool are only loose tiles, because the map doesn’t connect them to anything.
So the map shows the runtime parts of a model deployment as one graph, from the route to the pod, including the policies that decide who can reach it. The custom resources that describe the deployment are not part of that graph, so to see how a ModelDeployment became a Workspace and a StatefulSet, I still need kubectl.
Logs and metrics, info and access
Those sections also give some input, but I didn’t find that too interesting and it didn’t really contribute to answer my question what a model deployment actually is, so I’ll skip them here
So, what is a model deployment?
A small custom resource that fans out into a workspace, a stateful set, a service, an inference pool, an endpoint picker and a route, with a gateway in front that lives somewhere else. A project doesn’t change any of that, but it is the unit where quota, network policies and access apply, and those were exactly the places where it broke. They are all fixed by scripts now.
Overall, taking a look at it as a project proved interesting as it gave me the insight I wanted in seeing what a model deployment actually creates. And it gave me a chance to play a bit with AKS projects :)
Webmentions:
No webmentions were found.
No likes were found.
No reposts were found.