Debugging BC when using VS Code's Remote Development (SSH) feature
As described in my previous blog post, you can use the Remote Development feature of VS Code to seamlessly develop with a big Azure VM as “workhorse”. However the usual debug workflow doesn’t work as expected as the AL extension is not fully prepared to work remotely. But if you are willing to do a bit more setup - and you already need to do quite some setup, so a bit more shouldn’t matter… - then you can get quite close.

The TL;DR
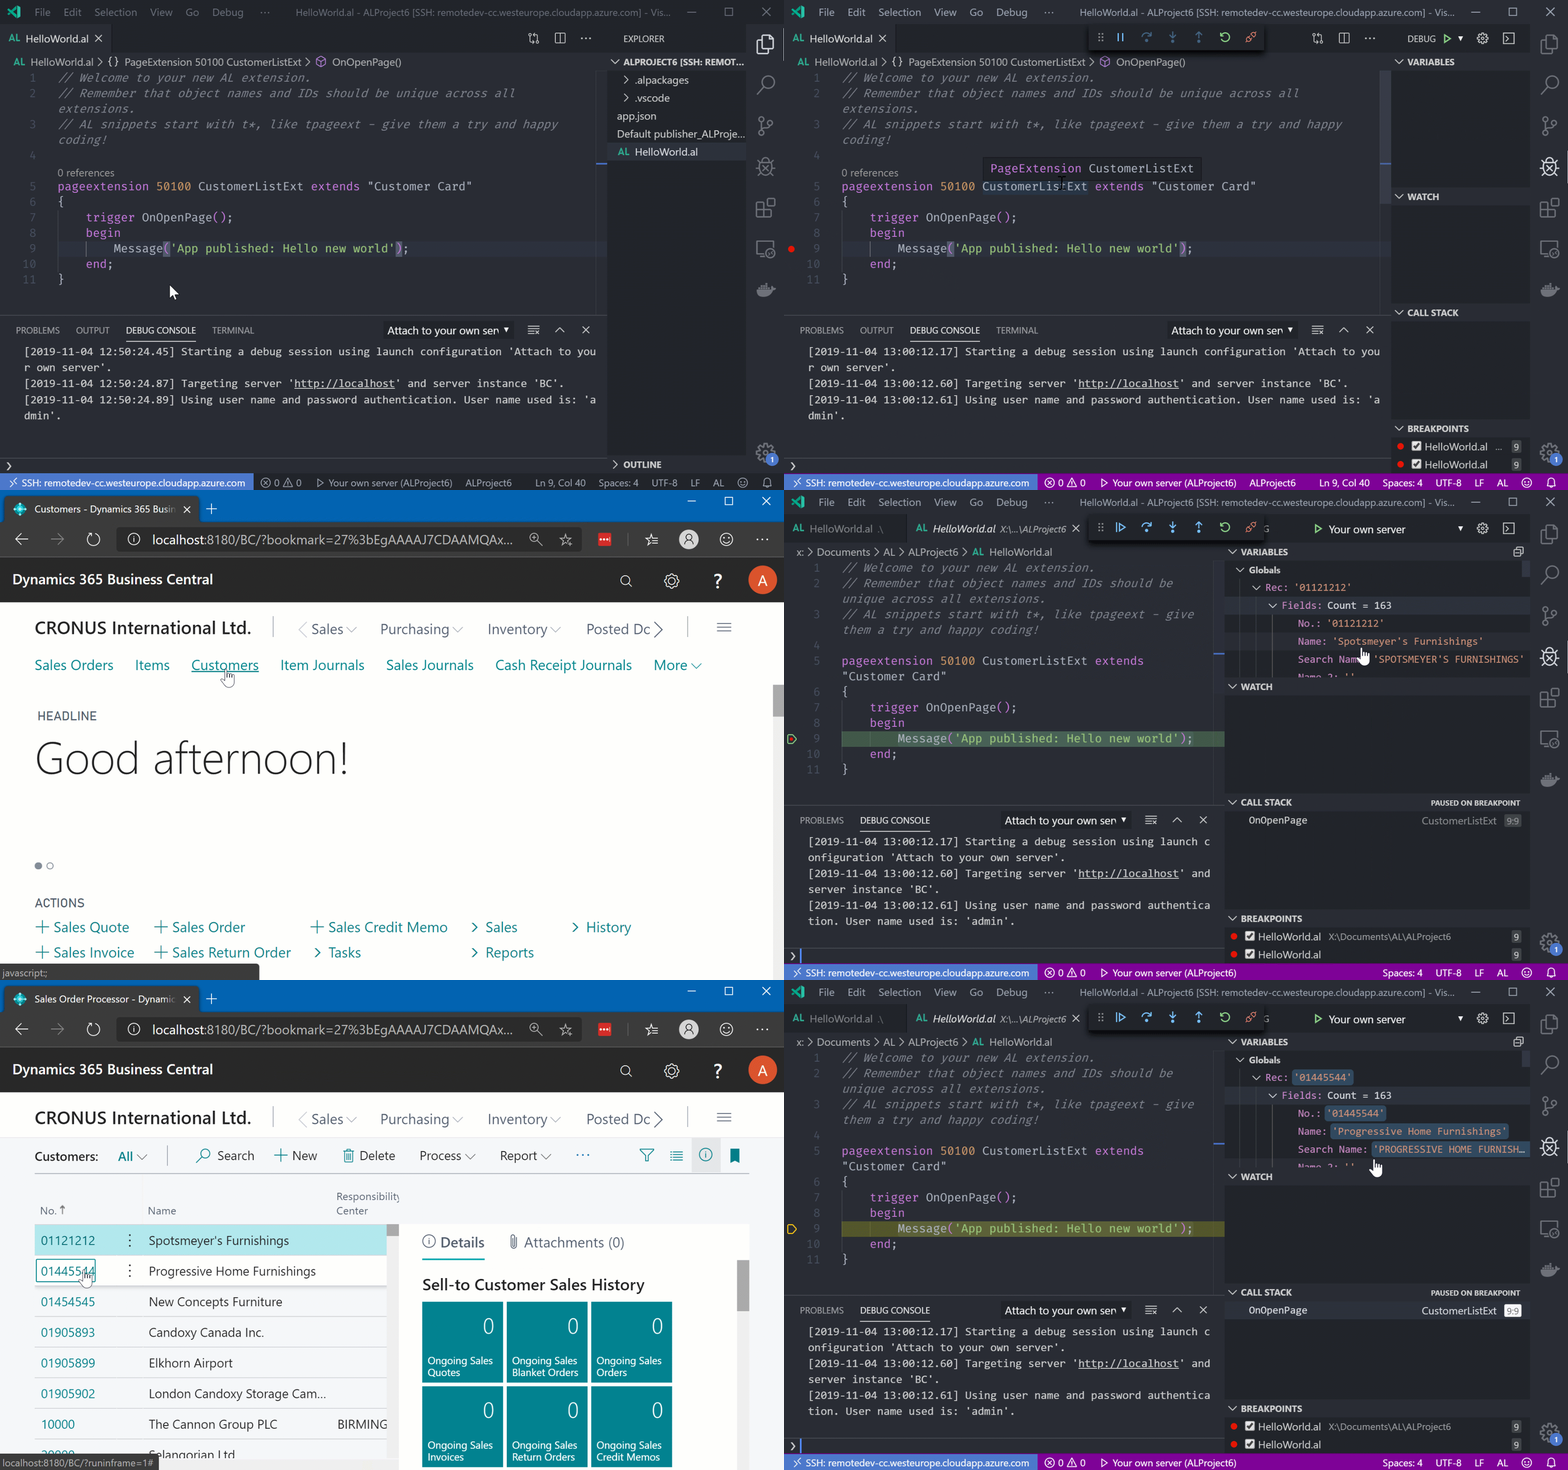
I am using the new “Attach and debug next” feature of the AL extension, which allows you launch the debugger in VS Code and wait for a WebClient session1 without opening a browser from VS Code. Then you just open a new session in your local browser and debugging works! The two additional things you need to do are:
- Create a launch configuration as described in the link above. For an example how it works with my Remote Dev setup, see below
- Map the remote source folder to a local path. That unfortunately is necessary as the AL debugger looks for a local file when the breakpoint is hit, instead of a remote file.
The details
My launch.json looks like this and if you follow the instruction in my previous blog post, this should hopefully work for you as well, if you want to give it a try:
1
2
3
4
5
6
7
8
9
10
11
12
13
14
15
16
17
18
19
20
21
22
23
24
25
26
27
28
29
30
31
32
33
{
    "version": "0.2.0",
    "configurations": [
        {
            "type": "al",
            "request": "launch",
            "name": "Your own server",
            "server": "http://localhost",
            "serverInstance": "BC",
            "port": 7149,
            "authentication": "UserPassword",
            "startupObjectId": 22,
            "startupObjectType": "Page",
            "breakOnError": true,
            "launchBrowser": false,
            "enableLongRunningSqlStatements": true,
            "enableSqlInformationDebugger": true
        },
        {
            "type": "al",
            "request": "attach",
            "name": "Attach to your own server",
            "server": "http://localhost",
            "serverInstance": "BC",
            "port": 7149,
            "authentication": "UserPassword",
            "breakOnError": true,
            "breakOnNext": "WebClient",
            "enableLongRunningSqlStatements": true,
            "enableSqlInformationDebugger": true
        }
    ]
}
If you check line 21, you see that the second configuration only attaches the debugger. It also is set up to break when the next WebClient hits a breakpoint (line 28). With that in place you can just launch with F5, select that particular launch config and attach the debugger. After that, open a new browser tab and enter http://localhost:8180 to connect to your BC instance with a new session. Make sure to follow the recommendations in the official documentation on this topic as otherwise it might not work.
Now when you hit a breakpoint, VS Code will trigger and you can see the debugger. But as mentioned above, the AL debugger unfortunately only checks local files, so we need to make sure the file path on our remote dev VM and on our local machine are identical and the files are synchronized. The easiest way for that is to use SSHFS as described here. After the initial setup I used the following command to map my remote home folder as it is quite small, but depending on your setup you might want to map only a subfolder:
1
net use /PERSISTENT:NO X: \\sshfs\vmadmin@remotedev-cc.westeurope.cloudapp.azure.com
Replace vmadmin with the username you have on the remote machine and remotedev-cc.westeurope.cloudapp.azure.com with the name of your VM. After that we have an X drive locally with the files from the remote machine. In order to have the same on the VM, I used the following command to create an X drive there as well, mapped to the home folder:
1
subst x: c:\users\vmadmin
Replace vmadmin with the username you have on the remote machine. If you now open the project from x:\... through the Remote Development extension and the breakpoint hits, it looks for a local file under x:\... as well and because of the SSHFS setup above, it will find it!
Still a bit more setup than strictly necessary, but after that a couple of quick tests seemed to work very well. I had to reconnect the SSHFS share a number of times as it seems to lose connection after a bit, but that might be some configuration I missed. If I find the time, I might add a “Remote debug” action to my VS Code extension, so that starting the debug session becomes easier. Stay tuned…
Footnotes
-
And other session types, but here we will be using the WebClient ↩
Webmentions:
.png)