.png)
Logging and service monitoring in Windows Containers and AKS
To continue on the topic of running Windows Server 2025 containers and doing so on the Azure Kubernetes Service (AKS), this blog post explains how you can use LogMonitor and ServiceMonitor to run and monitor your Windows applications safely in AKS.
The TL;DR
To just give it a try, clone https://github.com/tfenster/logged-iis, which has all the sources you need. Then do the following:
- Create a cluster using CreateCluster.ps1
- Deploy my demo IIS container with
kubectl apply -f iis.yamland get the external IP withkubectl get services - Open the IIS starting page on that IP with something like
http://9.141.62.204(your IP will of course be different) - Check the logs in Azure Monitor, which should show you something like this
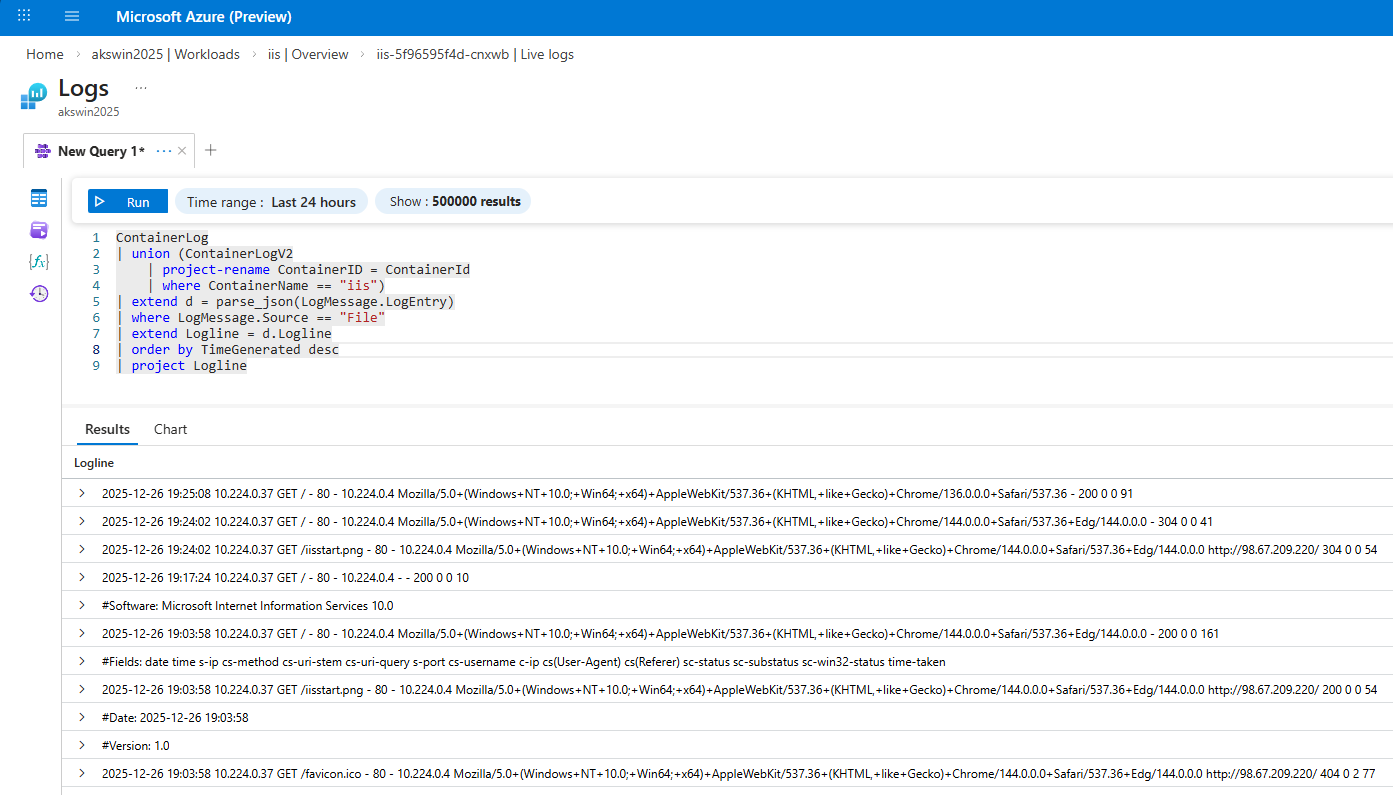
This is now an IIS container deployed to AKS that monitors the IIS Windows Service (W3SVC) through ServiceMonitor and puts the relevant logs to STDOUT through LogMonitor, which can then be collected in Azure Monitor. Now let’s take a look at the details how we got there.
The details: The container image with ServiceMonitor, LogMonitor and LogMonitorConfig.json
To get this to work from the container perspective, I used the same approach as explained previously to get IIS running in a Nano Server. What is special for the LogMonitor and ServiceMonitor, is the installation in the Dockerfile, based on a blog post about LogMonitor.
1
2
3
4
5
6
7
8
9
10
11
12
13
14
15
FROM mcr.microsoft.com/windows/servercore:ltsc2025 AS download
WORKDIR /download
RUN powershell -Command \
    Invoke-WebRequest -Uri "https://github.com/microsoft/IIS.ServiceMonitor/releases/download/v2.0.1.10/ServiceMonitor.exe" -OutFile ".\ServiceMonitor.exe"; \
    Invoke-WebRequest -Uri "https://github.com/microsoft/windows-container-tools/releases/download/v2.1.3/LogMonitor.exe" -OutFile ".\LogMonitor.exe"

FROM mcr.microsoft.com/windows/nanoserver:ltsc2025
WORKDIR /install
COPY install_iis.cmd ./
COPY --from=download /download/ ./
USER ContainerAdministrator
RUN install_iis.cmd
WORKDIR /LogMonitor
COPY LogMonitorConfig.json ./
ENTRYPOINT ["C:\\install\\LogMonitor.exe", "C:\\install\\ServiceMonitor.exe", "W3SVC"]
In the end, I want to run in a Nano Server, but that base image doesn’t have any capability to download a file1, so I went multi-stage with a Server Core base for the downloads first as you can see in lines 1-5. The files are then moved into the final stage in line 10. As mentioned above, the installation of IIS is the same as in my previous blog post. You can also see how LogMonitor is used with a nested ServiceMonitor call to monitor the IIS service in line 15. This runs LogMonitor with a configuration explained below, but also ServiceMonitor, which exits when the service state changes from SERVICE_RUNNING to anything else.
Potentially also interesting is the configuration of the collected logs in LogMonitorConfig.json, based on a sample in the official docs.
1
2
3
4
5
6
7
8
9
10
11
12
13
14
15
16
17
18
19
20
21
22
23
24
25
26
27
28
29
30
31
32
33
34
35
36
37
38
39
40
41
42
43
{
    "LogConfig": {
        "sources": [
            {
                "type": "EventLog",
                "startAtOldestRecord": true,
                "eventFormatMultiLine": false,
                "channels": [
                    {
                        "name": "application",
                        "level": "error"
                    },
                    {
                        "name": "system",
                        "level": "error"
                    }
                ]
            },
            {
                "type": "File",
                "directory": "c:\\inetpub\\logs",
                "filter": "*.log",
                "includeSubdirectories": true
            },
            {
                "type": "ETW",
                "eventFormatMultiLine": false,
                "providers": [
                    {
                        "providerName": "IIS: WWW Server",
                        "providerGuid": "3A2A4E84-4C21-4981-AE10-3FDA0D9B0F83",
                        "level": "Information"
                    },
                    {
                        "providerName": "Microsoft-Windows-IIS-Logging",
                        "providerGuid": "7E8AD27F-B271-4EA2-A783-A47BDE29143B",
                        "level": "Information"
                    }
                ]
            }
        ]
    }
}
This collects information from the standard Windows event log (lines 4-18), from the IIS file-based logs (lines 19-24) and from the Event Tracing for Windows (ETW, lines 25-40). With that, we can see in STDOUT what goes on in the system generally and especially with IIS.
The details: AKS deployment
The AKS deployment in CreateCluster.ps1 is again very similar to what I shared before:
1
2
3
4
5
6
7
8
9
10
11
12
13
14
15
az extension add --name aks-preview
az extension update --name aks-preview

az feature register --namespace "Microsoft.ContainerService" --name "AksWindows2025Preview"
az feature show --namespace Microsoft.ContainerService --name AksWindows2025Preview
az provider register --namespace Microsoft.ContainerService

$name = "akswin2025"
$region = "germanywestcentral"
$vmSize = "Standard_B4ls_v2"
az group create --name $name --location $region
az aks create -g $name -n $name --node-count 1 -s $vmSize --tier free --network-plugin azure --enable-app-routing --no-ssh-key --vm-set-type VirtualMachineScaleSets --network-plugin azure --enable-azure-monitor-metrics
az aks nodepool add --resource-group $name --cluster-name $name --os-type Windows --os-sku Windows2025 --name npwin --node-count 1 --ssh-access disabled --enable-fips-image
az aks enable-addons --addon monitoring --name $name --resource-group $name
az aks get-credentials --resource-group $name --name $name --overwrite-existing
Notable differences are:
- The
--enable-azure-monitor-metricsparameter in line 12 when the cluster is created. This enables monitoring generally for the AKS cluster via a Azure Monitor workspace. To learn more, check the official docs. - The monitoring addon, enabled via
az aks enable-addons --addon monitoring...in line 14. This enables the collection of container logs. Again, to learn more, check the official docs
As explained above, LogMonitor with the right LogMonitorConfig.json makes sure that the right log entries end up in STDOUT and with the AKS setup explained here, that ends up in the workspace. With a KQL query like the following, also visible in the screenshot above, we can get e.g. the relevant parts from the IIS log files as they are also in STDOUT now:
1
2
3
4
5
6
7
8
9
ContainerLog
| union (ContainerLogV2
    | project-rename ContainerID = ContainerId
    | where ContainerName == "iis")
| extend d = parse_json(LogMessage. LogEntry)
| where LogMessage.Source == "File"
| extend Logline = d.Logline
| order by TimeGenerated desc
| project Logline
The deployment itself is trivial as you can see in iis.yaml. The only maybe relevant part is the usage of the tobiasfenster/logged-iis:nanoserver-ltsc2025 image, which is created using the Dockerfile above.
I hope this gives you an idea how to easily set up monitoring and logging for Windows containers in AKS, making them fit in the structure typically also used by Linux conatiners.
Webmentions:
No webmentions were found.

No reposts were found.