.png)
Debugging container image creation with a Dockerfile
If you have ever worked on even mildly complex container images based on Dockerfiles, then I am pretty sure that you know the pain of debugging when things go wrong. Typically, that meant juggling comments or removing parts of the Dockerfile to get an image during the intended build. Then, you would create a container and look at the resulting file system or run commands. Fortunately that has now changed as Docker has released a new feature that is available with the latest Docker Desktop and the latest VS Code Docker extension: Real debugging of the build process in VS Code! I’ll walk you through the main elements, but I would certainly also recommend reading the official announcement.
The TL;DR
Let’s assume that you have a Dockerfile that describes your container image. Then you need a launch configuration like this
1
2
3
4
5
6
7
{
    "name": "Docker: Build",
    "type": "dockerfile",
    "request": "launch",
    "dockerfile": "Dockerfile",
    "contextPath": "${workspaceFolder}",
}
With that in place, you can run the launch configuration as you would any other debug configuration by starting a debug session. If you have breakpoints in the Dockerfile, the debugger will stop, allowing you to view arguments and the file system, as well as access additional features, as explained below.
Pretty cool, right?
The details: My example and basic setup
As an example, I have created a simple .NET application using dotnet new console -n App. For that, I also created a Dockerfile, but to make things a bit more interesting, it is a multi-stage one:
1
2
3
4
5
6
7
8
9
10
11
12
13
14
15
16
17
18
FROM --platform=$BUILDPLATFORM mcr.microsoft.com/dotnet/sdk:10.0 AS build
ARG configuration=Release
WORKDIR /src
COPY ["App.csproj", "./"]
RUN dotnet restore "App.csproj"
COPY . .
WORKDIR "/src/."
RUN dotnet build "App.csproj" -c $configuration -o /app/build

FROM build AS publish
ARG configuration=Release
RUN dotnet publish "App.csproj" -c $configuration -o /app/publish /p:UseAppHost=false

FROM mcr.microsoft.com/dotnet/runtime:10.0 AS final
USER app
WORKDIR /app
COPY --from=publish /app/publish .
ENTRYPOINT ["dotnet", "App.dll"]
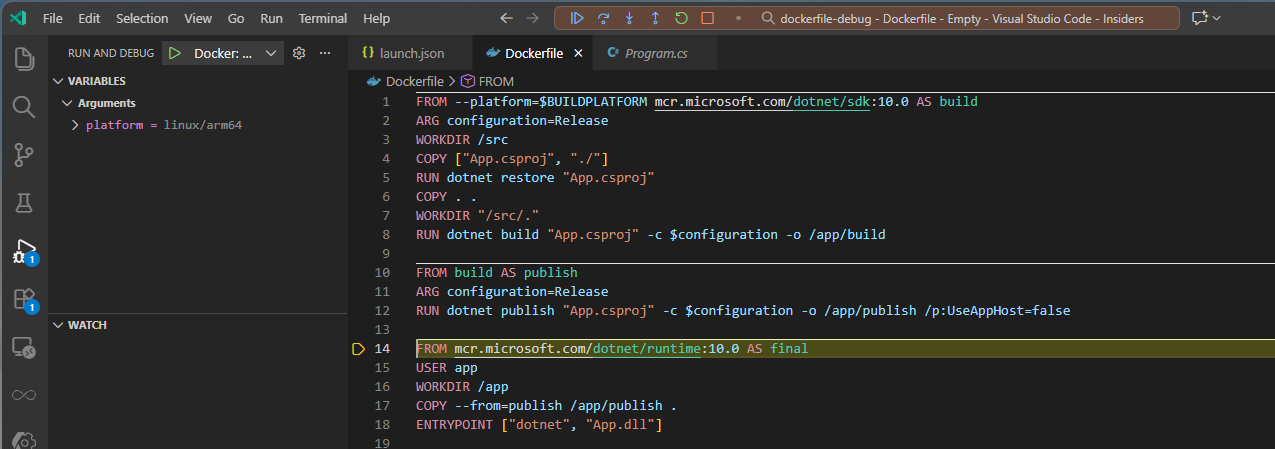
You can see the three stages, build, publish and final. As the names say, build and publish are for building and publishing, both using the full .NET SDK base image and the last one is for running only and uses the runtime image.
As mentioned in the TL;DR above, you need a launch configuration for debugging, which I showed in the previous paragraph.
One thing I struggled with initially was that at least for me, it didn’t work directly on Windows. Instead, I had to open a WSL terminal and start VS Code from there.
The details: Debugging
Another lesson I learned immediately was that breakpoints don’t get hit on every command. By chance I first tried with line 2 with the ARG call. The debugger didn’t stop. Thinking it might be due to the multi-stage nature of the image, so I tried line 15 with the USER call in the final stage. once again, the debugger didn’t stop. Only when I set the breakpoints on lines 3 and 16 which have the WORKDIR command, did the debugger stop. Also if I set the breakpoint on the very first line and went step by step using F10, the ARG and USER lines were never hit.
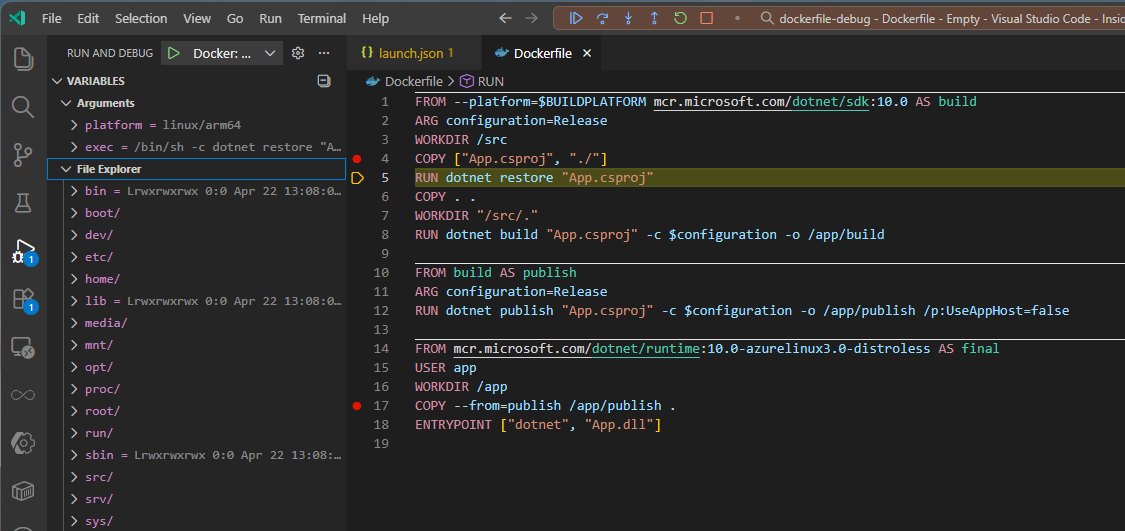
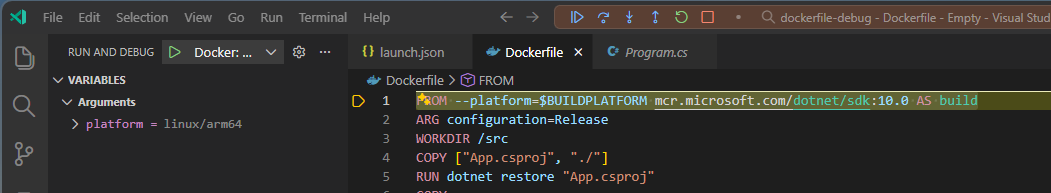
But once you know that, it works very conveniently. E.g. take the very first line FROM --platform=$BUILDPLATFORM mcr.microsoft.com/dotnet/sdk:10.0 AS build. If you want to figure out the value of $BUILDPLATFORM, just stop on that line and you can check the value under VARIABLES > Arguments > platform on the right
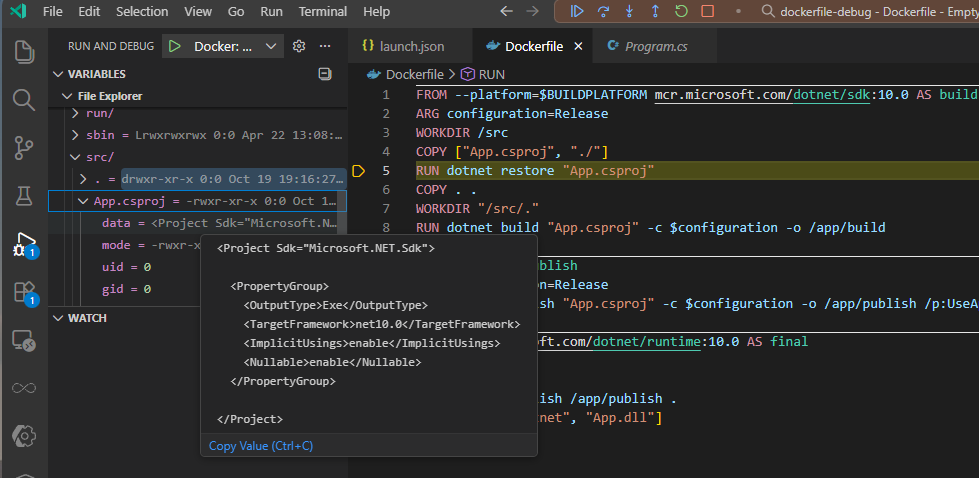
A few steps later, after the /src folder has been created and the App.csproj file is copied in, you can see the folder structure and file appear under VARIABLES > File Explorer and you can even see the content of a (text) file under date and as a mouseover.
In my opinion, the most useful feature is the ability to access an interactive console in the container during the build process. You can access this feature by typing exec into the command bar of the debug console in VS Code. With this feature, you can interact with the container during the build process. For example, you can run commands like this:
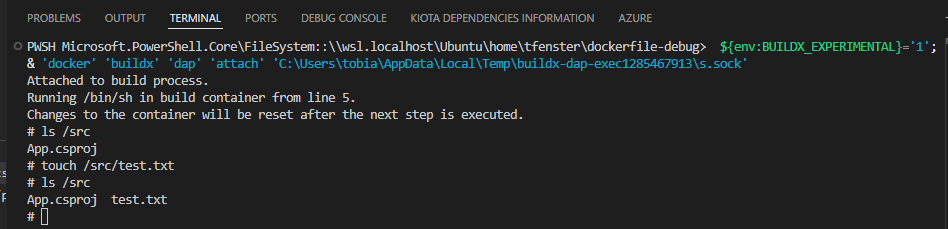
You can see that a new file was generated and that I could make changes to the container’s file system. However, once I step to the next line, this happens:
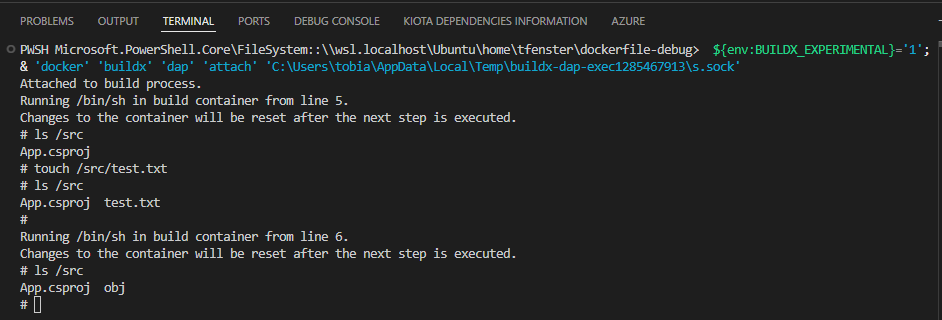
As we now have an obj folder, you can see that the dotnet restore has happened. At the same time, the test.txt file that was created interactively has disappeared because those changes are revoked once we go to the next line in the debugger.
The details: Multi-stage images and debugging immediately
One thing that worked quite intuitively for me was using multi-stage images. Setting "stopOnEntry": true in your launch config causes the debugger to stop immediately upon entering the build process. Interestingly, though, it doesn’t stop on line 1, as you might imagine, but rather on the first line of the final stage.
If you use F10 to step over lines, you will never reach the other stages. However, if you use Step Into or hit F11 on line 17, which references another stage, the debugger will go to that stage. As a developer, I find this very intuitive because it’s the same way I would step into a function.
I hit a few early hiccups when trying out the new debugger, but once I understood how it worked and set it up correctly, it worked really well. I am quite sure that it will come in handy if I run into issues with my Dockerfiles!
Webmentions:
-
Oh I like this
No reposts were found.